USGS visual id


Drought Watch Virginia

Virginia Drought News graphic Drought Definitions

frequently asked questions


Southwest Virginia is part of the central highlands that are experiencing moderate to severe hydrologic drought as indicated by streamflow conditions. (May 31, 2007)

Streamflow-duration plots now available for Virginia.

Daily streamflow conditions

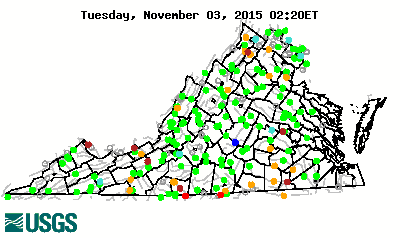
Real-time streamflow for Virginia District

The real-time data used to produce this map are provisional and have not been reviewed or edited. They may be subject to significant change. The map depicts streamflow conditions as measured at USGS gaging stations. The colors represent discharge as a percentile, which is computed from the period of record for the current day of the year. Only stations having at least 30 years of record are used.   Map Explanation


Ground-water conditions

Ground-water conditions in Virginia

 
Drought Watch:
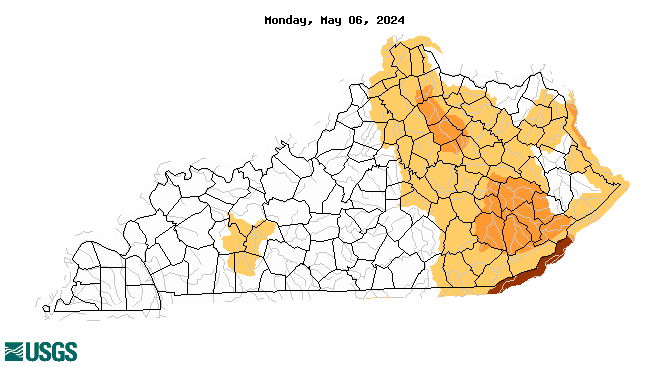
Kentucky:below normal 7-day average streamflow condition map Virginia: below normal 7-day average streamflow condition map
Drought Watch: Kentucky Drought Watch: Virginia
Tennessee: below normal 7-day average streamflow condition map North Carolina: below normal 7-day average streamflow condition map
Drought Watch: Tennessee Drought Watch: North Carolina

Click map to obtain more detailed drought information for the state

map legend for below normal 7-day average streamflow condition map

These maps show the 7-day average streamflow conditions in hydrologic units of the United States and Puerto Rico for the day of year. The colors represent 7-day average streamflow percentiles based on historical streamflow for the day of the year. Thus, the maps show conditions adjusted for this time of the year. Only stations having at least 30 years of record are used. Subregions shaded gray indicate that insufficient data were available to compute a reliable 7-day average streamflow value. During winter months, this situation frequently arises due to ice effects. The data used to produce these maps are provisional and have not been reviewed or edited. They may be subject to significant change.


Drought Indicators

U.S. streamflow conditions

U.S. streamflow conditions

U.S. Drought Conditions

usgs drought watch map

Standardized Precipitation Index
(6 months)

Standardized Precipitation Index


U.S. Drought Monitor
Palmer Drought Severity Index
Seasonal U.S. Drought Outlook
Seasonal Drought Outlook

Drought Termination and Amelioration Ending Current Drought
(from NOAA, National Climatic Data Center: 36 maps)


Drought Information for Virginia

Historic Droughts

Reports from Local Newspapers

State Climatology Office

Regional Drought Information

Regional USGS Press Releases

Northeast Regional Climate Center

Potomac River Streamflow  

Chesapeake Bay Freshwater Inflow

DC Metro Ground-Water Levels

Drought Information from Other Federal Agencies and National Organizations

National Drought Mitigation Center

National Drought Monitor

NOAA:  
Drought Information Center
Climate Prediction Center
National Climatic Data Center (Climate Research and Drought)
Drought Termination And Amelioration
Paleoclimatology of Drought
 
National Weather Service   
     Forecast Offices: Sterling | Wakefield | Blacksburg | Morristown | more...
     River Forecast Centers: Mid-Atlantic | Ohio
     Drought Statements
Weekly Weather & Crop Bulletin
National Fire Plan: State Programs
 
Contact: GS-W-VArmd_webmaster@usgs.gov
U.S. Department of Interior, U.S. Geological Survey
Privacy Statement

Disclaimer
USA.Gov: The U.S. Government's Official Web Portal


URL://va.water.usgs.gov/drought/index.htm     Last modified: 03/21/08 07:28:51 AM