|
|
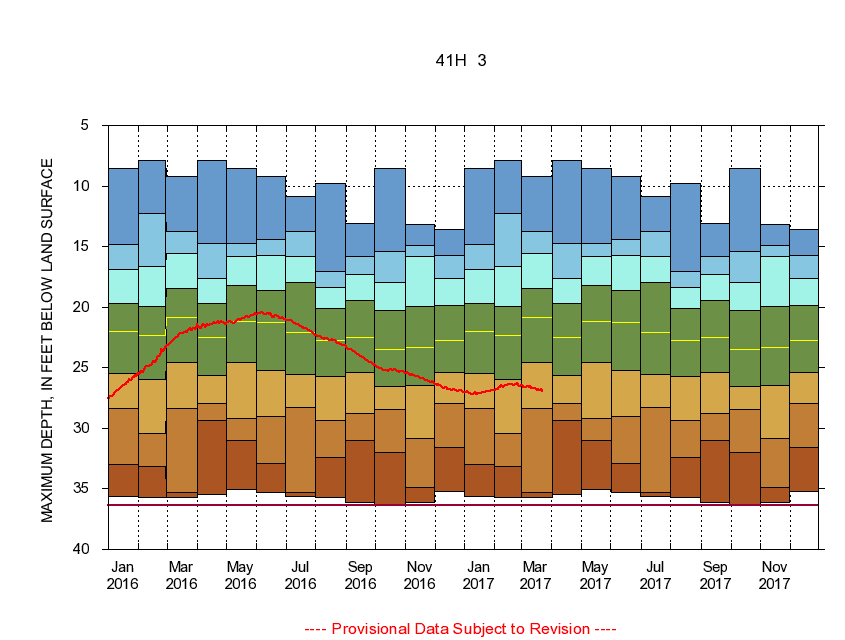
372608078404601 41H 3
|
|
|
LOCATION.--Latitude 37°26'08", Longitude 78°40'46", North American Datum of 1927
Buckingham County, Va., Hydrologic Unit 02080207.
|
|
|
WELL CHARACTERISTICS.--Well is located in Metagraywacke, quartzose schist, and melange of Cambrian age. Depth 54 ft.
|
|
|
PERIOD OF RECORD.--Continual data, September 1971 to current year. Periodic data, March 1971 to current year.
|
|
|
DURATION STATISTIC COMPUTATION PERIOD.--All continual data through September 2015, all approved periodic data.
|
|
|
EXTERNAL INFLUENCE.--No known external influences.
|
|
|
GAGE OPERATION.--U.S. Geological Survey, Virginia Water Science Center.
|
|
|
|
|