USGS - science for a changing world
Virginia DEQ

Virginia Water Science Center

 
  Duration Plot and Table of Daily Groundwater Levels
 
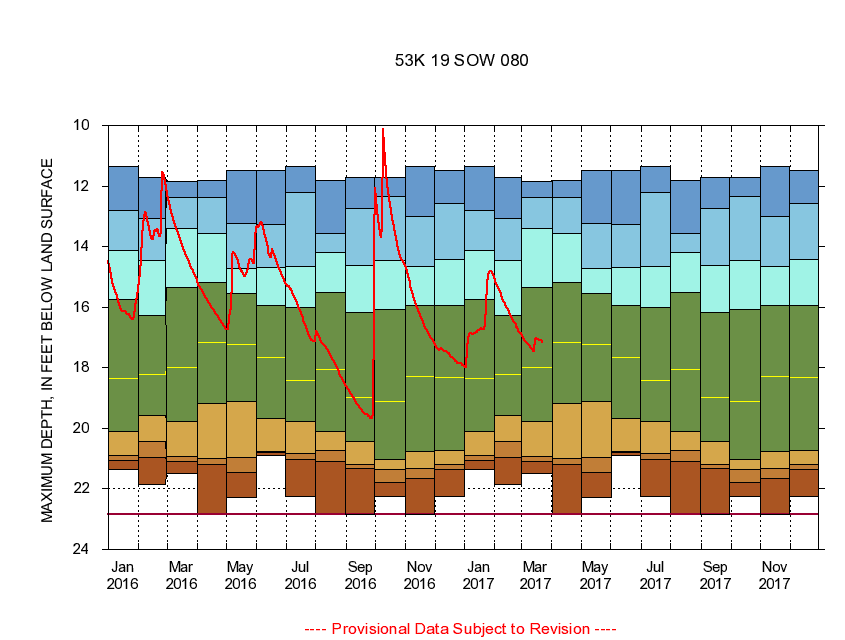
373737077083201 53K 19 SOW 080
LOCATION.--Latitude 37°37'37", Longitude 77°08'32", North American Datum of 1927
                    Hanover County, Va., Hydrologic Unit 02080106.
WELL CHARACTERISTICS.--Well is located in Yorktown-Eastover aquifer of Miocene-Pliocene age. Depth 35 ft.
PERIOD OF RECORD.--Continual data, July 2004 to current year. Periodic data, January 1978 to current year.
DURATION STATISTIC COMPUTATION PERIOD.--All continual data through September 2015, all approved periodic data.
EXTERNAL INFLUENCE.--No known external influences.
GAGE OPERATION.--Virginia Department of Environmental Quality - Water Division.

     Duration Plot with Daily Groundwater Level Conditions
Provisional Data Subject to Revision
373737077083201 plot. 
53K 19
Provisional Data Subject to Revision


The current daily value for 03/22/2017 is 17.15 feet below land surface.

  explanation   Percentile Description Duration Plot Description 28 Day 14 Day 7 Day Daily


      Duration Table of Daily Groundwater Levels
           
Maximum depth below land surface, in feet


                373737077083201     53K 19

   Lowest Level
   5th percentile
 
   10th percentile
 
   25th percentile
 
 
   Median
 
 
   75th percentile


   90th percentile


   95th percentile


   Highest Level
         
Years of record
January
22.25
21.16
21.00
20.25
18.35
16.00
14.77
13.45
11.37
 
60
February
22.85
20.87
20.44
19.07
16.58
15.26
14.14
12.37
12.00
 
49
March
21.48
21.11
20.87
19.59
18.00
15.28
13.68
11.92
11.85
 
52
April
21.21
20.94
20.76
18.93
16.30
14.77
13.07
12.15
11.81
 
60
May
21.48
21.15
20.97
19.80
16.93
15.49
13.75
11.81
11.49
 
59
June
21.86
21.35
20.95
19.58
17.70
16.57
14.50
13.32
11.73
 
58
July
22.25
20.93
20.86
19.67
18.80
16.56
14.72
13.02
11.37
 
61
August
22.85
21.11
20.61
20.26
19.49
16.99
15.16
13.14
11.49
 
57
September
21.86
21.18
20.89
20.51
18.91
16.12
14.84
12.48
11.73
 
54
October
22.85
22.23
21.48
21.00
18.91
15.81
14.11
12.13
11.85
 
61
November
22.27
21.98
21.49
20.99
19.49
16.27
14.55
13.64
11.49
 
53
December
22.19
21.41
21.21
20.36
17.82
15.59
13.10
12.54
12.45
 
55
 
       
Instantaneous lowest water level for period of record = 22.85 feet below land surface.

The current daily value for 03/22/2017 is 17.15 feet below land surface.

---- Provisional Data Subject to Revision ----

Accessibility FOIA Privacy Policies and Notices

Take Pride in America logo USA.gov logo U.S. Department of the Interior | U.S. Geological Survey
URL: http://va.water.usgs.gov/duration_plots/daily/dp373737077083201.htm
Page Contact Information: Virginia WSC Webmaster
Page Last Modified: 6/19/2016