|
01643880
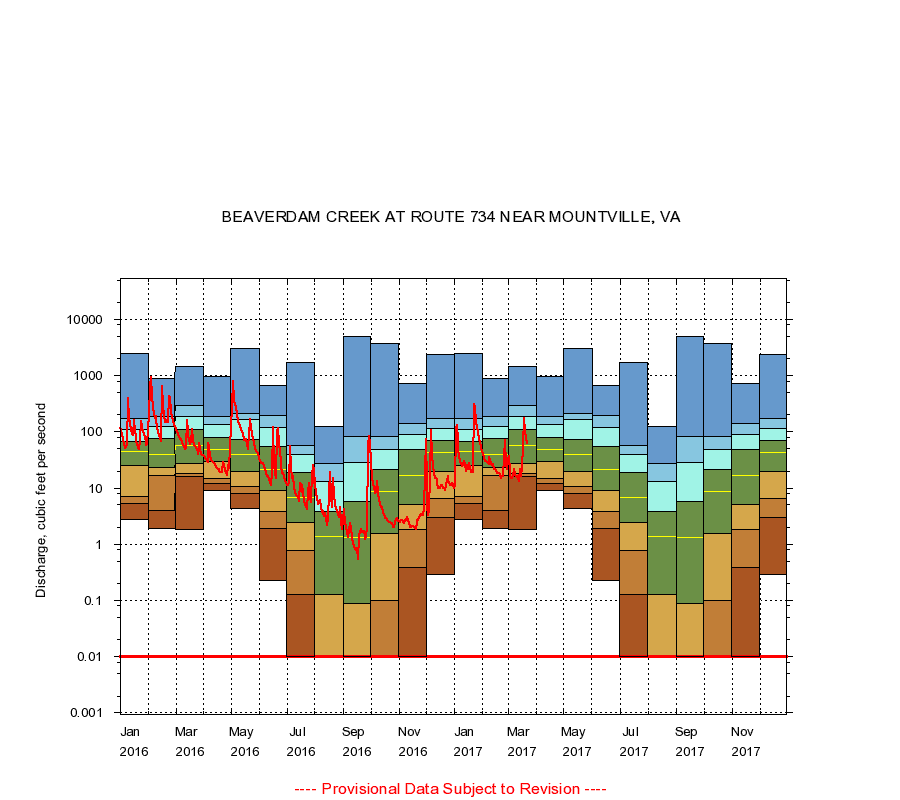
BEAVERDAM CREEK AT ROUTE 734 NEAR MOUNTVILLE, VA
|
Minimum daily flow
|
|
|
5th percentile
|
|
|
|
10th percentile
|
|
|
|
|
25th percentile
|
|
|
|
|
|
Median
|
|
|
|
|
|
|
75th percentile
|
|
|
|
|
|
|
|
90th percentile
|
|
|
|
|
|
|
|
|
95th percentile
|
|
|
|
|
|
|
|
|
|
Maximum daily flow
|
|
|
|
|
|
|
|
|
|
|
|
Years of record
|
January
|
2.80
|
5.28
|
7.00
|
25.0
|
44.0
|
66.0
|
110
|
172
|
2,490
|
|
14
|
February
|
1.90
|
3.96
|
17.0
|
23.0
|
40.0
|
75.0
|
124
|
189
|
873
|
|
14
|
March
|
1.80
|
16.0
|
18.0
|
27.0
|
57.0
|
110
|
188
|
292
|
1,420
|
|
14
|
April
|
9.00
|
12.0
|
15.0
|
30.0
|
48.5
|
78.0
|
136
|
188
|
955
|
|
14
|
May
|
4.30
|
8.08
|
10.5
|
20.0
|
40.0
|
74.0
|
164
|
214
|
3,060
|
|
14
|
June
|
0.23
|
1.90
|
3.80
|
9.12
|
21.0
|
53.8
|
117
|
196
|
672
|
|
14
|
July
|
0.00
|
0.13
|
0.78
|
2.40
|
6.70
|
18.8
|
40.0
|
58.1
|
1,710
|
|
14
|
August
|
0.00
|
0.00
|
0.00
|
0.13
|
1.40
|
3.80
|
13.0
|
27.1
|
126
|
|
15
|
September
|
0.00
|
0.00
|
0.00
|
0.09
|
1.30
|
5.65
|
28.8
|
81.8
|
5,000
|
|
15
|
October
|
0.00
|
0.00
|
0.10
|
1.58
|
8.55
|
21.0
|
48.0
|
81.2
|
3,710
|
|
14
|
November
|
0.00
|
0.39
|
1.81
|
5.20
|
17.0
|
48.8
|
90.9
|
142
|
726
|
|
14
|
December
|
0.29
|
2.95
|
6.45
|
20.0
|
42.0
|
69.2
|
113
|
172
|
2,330
|
|
14
|
|
|
Instantaneous minimum flow for period of record =
0.00
cubic feet per second.
Flow values of 0.00 are plotted as 0.01
The current daily value for 03/22/2017 is 61.0 cubic feet per second.
----
Provisional Data Subject to Revision ----
|