|
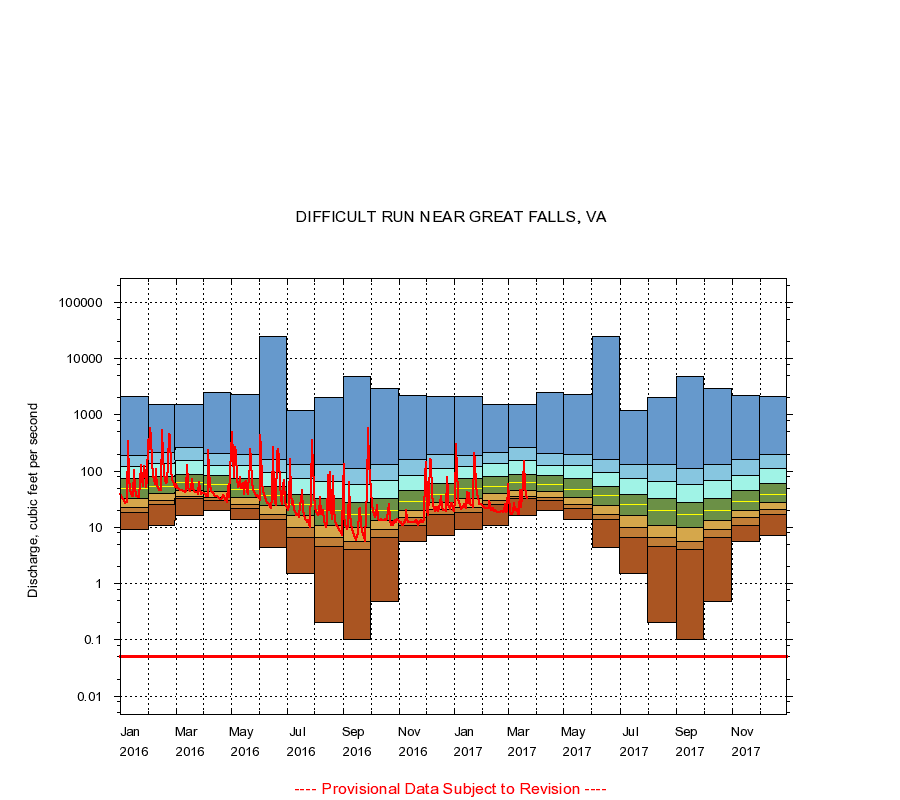
01646000
DIFFICULT RUN NEAR GREAT FALLS, VA
|
Minimum daily flow
|
|
|
5th percentile
|
|
|
|
10th percentile
|
|
|
|
|
25th percentile
|
|
|
|
|
|
Median
|
|
|
|
|
|
|
75th percentile
|
|
|
|
|
|
|
|
90th percentile
|
|
|
|
|
|
|
|
|
95th percentile
|
|
|
|
|
|
|
|
|
|
Maximum daily flow
|
|
|
|
|
|
|
|
|
|
|
|
Years of record
|
January
|
9.00
|
18.0
|
23.0
|
32.0
|
49.0
|
73.0
|
122
|
192
|
2,100
|
|
80
|
February
|
11.0
|
25.0
|
30.0
|
40.0
|
53.0
|
79.0
|
136
|
218
|
1,500
|
|
80
|
March
|
16.0
|
32.0
|
36.0
|
45.0
|
62.0
|
88.0
|
154
|
262
|
1,510
|
|
80
|
April
|
20.0
|
30.0
|
34.0
|
43.0
|
57.0
|
83.0
|
128
|
209
|
2,530
|
|
81
|
May
|
14.0
|
22.0
|
26.0
|
34.0
|
48.0
|
74.0
|
126
|
200
|
2,310
|
|
81
|
June
|
4.30
|
14.0
|
17.0
|
24.0
|
37.0
|
53.0
|
94.9
|
162
|
25,000
|
|
81
|
July
|
1.50
|
6.60
|
10.0
|
16.0
|
26.0
|
39.0
|
74.0
|
129
|
1,200
|
|
81
|
August
|
0.20
|
4.50
|
6.50
|
11.0
|
20.0
|
32.0
|
65.0
|
130
|
2,000
|
|
81
|
September
|
0.10
|
4.10
|
5.70
|
9.80
|
17.0
|
28.0
|
57.0
|
112
|
4,860
|
|
81
|
October
|
0.48
|
6.50
|
9.10
|
13.0
|
20.0
|
33.0
|
69.0
|
130
|
3,000
|
|
80
|
November
|
5.70
|
11.0
|
15.0
|
20.0
|
29.0
|
46.0
|
83.9
|
159
|
2,220
|
|
80
|
December
|
7.20
|
17.0
|
21.0
|
28.0
|
39.0
|
60.0
|
110
|
195
|
2,140
|
|
80
|
|
|
Instantaneous minimum flow for period of record =
0.05
cubic feet per second.
The current daily value for 03/22/2017 is 33.0 cubic feet per second.
----
Provisional Data Subject to Revision ----
|