|
01669520
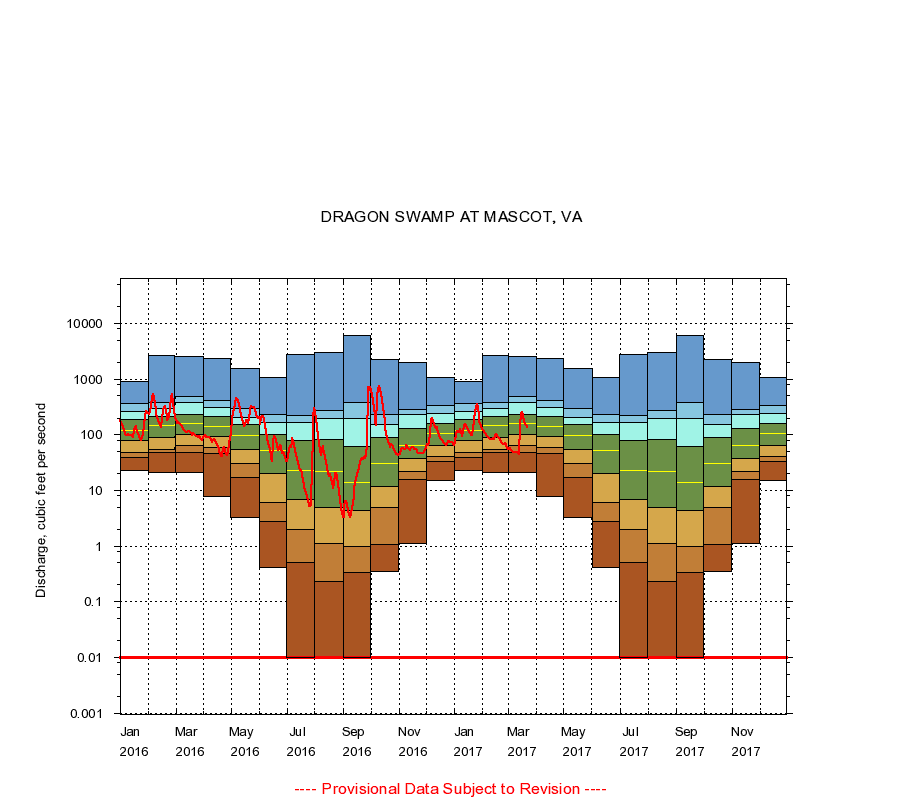
DRAGON SWAMP AT MASCOT, VA
|
Minimum daily flow
|
|
|
5th percentile
|
|
|
|
10th percentile
|
|
|
|
|
25th percentile
|
|
|
|
|
|
Median
|
|
|
|
|
|
|
75th percentile
|
|
|
|
|
|
|
|
90th percentile
|
|
|
|
|
|
|
|
|
95th percentile
|
|
|
|
|
|
|
|
|
|
Maximum daily flow
|
|
|
|
|
|
|
|
|
|
|
|
Years of record
|
January
|
23.0
|
39.8
|
49.0
|
80.0
|
120
|
187
|
262
|
358
|
910
|
|
34
|
February
|
21.0
|
48.0
|
55.1
|
88.0
|
147
|
209
|
297
|
388
|
2,690
|
|
34
|
March
|
21.0
|
49.0
|
65.0
|
103
|
160
|
235
|
374
|
489
|
2,530
|
|
34
|
April
|
7.70
|
46.0
|
60.0
|
94.2
|
138
|
212
|
309
|
407
|
2,380
|
|
34
|
May
|
3.30
|
17.0
|
30.0
|
55.0
|
95.5
|
154
|
207
|
293
|
1,570
|
|
34
|
June
|
0.41
|
2.80
|
6.12
|
20.0
|
52.0
|
100
|
167
|
235
|
1,070
|
|
34
|
July
|
0.00
|
0.50
|
2.00
|
6.78
|
23.0
|
80.0
|
167
|
224
|
2,800
|
|
34
|
August
|
0.00
|
0.23
|
1.10
|
5.00
|
22.0
|
82.0
|
197
|
273
|
3,060
|
|
34
|
September
|
0.00
|
0.34
|
0.97
|
4.40
|
14.0
|
61.2
|
196
|
386
|
6,050
|
|
35
|
October
|
0.35
|
1.08
|
4.85
|
12.0
|
30.0
|
90.2
|
153
|
227
|
2,210
|
|
34
|
November
|
1.10
|
16.0
|
22.0
|
37.0
|
65.0
|
131
|
229
|
285
|
1,980
|
|
34
|
December
|
15.0
|
33.0
|
40.0
|
63.0
|
105
|
158
|
246
|
332
|
1,060
|
|
34
|
|
|
Instantaneous minimum flow for period of record =
0.00
cubic feet per second.
Flow values of 0.00 are plotted as 0.01
The current daily value for 03/22/2017 is 135.0 cubic feet per second.
----
Provisional Data Subject to Revision ----
|

