|
01674500
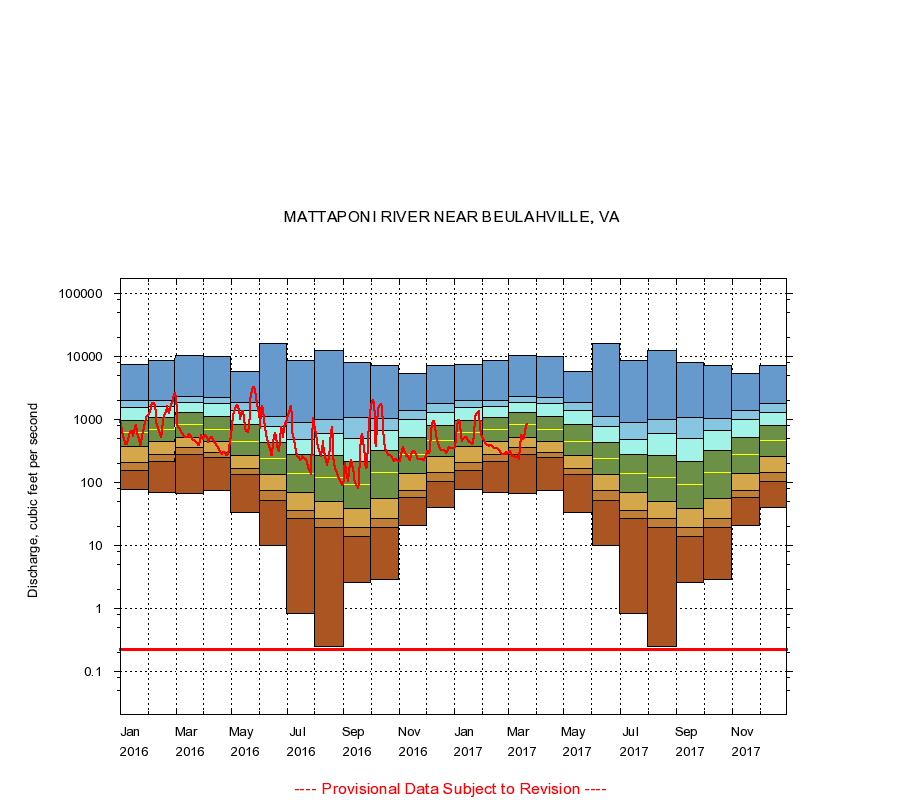
MATTAPONI RIVER NEAR BEULAHVILLE, VA
|
Minimum daily flow
|
|
|
5th percentile
|
|
|
|
10th percentile
|
|
|
|
|
25th percentile
|
|
|
|
|
|
Median
|
|
|
|
|
|
|
75th percentile
|
|
|
|
|
|
|
|
90th percentile
|
|
|
|
|
|
|
|
|
95th percentile
|
|
|
|
|
|
|
|
|
|
Maximum daily flow
|
|
|
|
|
|
|
|
|
|
|
|
Years of record
|
January
|
77.0
|
152
|
208
|
377
|
616
|
958
|
1,520
|
1,970
|
7,560
|
|
74
|
February
|
69.0
|
218
|
277
|
440
|
695
|
1,080
|
1,590
|
1,970
|
8,720
|
|
74
|
March
|
66.0
|
275
|
352
|
520
|
815
|
1,270
|
1,860
|
2,350
|
10,500
|
|
74
|
April
|
75.0
|
249
|
300
|
438
|
685
|
1,130
|
1,800
|
2,200
|
9,810
|
|
74
|
May
|
33.0
|
132
|
165
|
267
|
450
|
820
|
1,380
|
1,820
|
5,740
|
|
74
|
June
|
10.0
|
52.0
|
73.0
|
131
|
242
|
428
|
778
|
1,120
|
16,200
|
|
74
|
July
|
0.82
|
27.0
|
36.0
|
68.0
|
140
|
273
|
481
|
880
|
8,580
|
|
74
|
August
|
0.25
|
19.0
|
27.0
|
49.8
|
118
|
269
|
594
|
1,010
|
12,200
|
|
74
|
September
|
2.60
|
14.0
|
19.3
|
38.0
|
91.5
|
218
|
495
|
1,090
|
8,030
|
|
74
|
October
|
2.90
|
19.0
|
27.0
|
55.0
|
143
|
316
|
670
|
1,030
|
7,250
|
|
74
|
November
|
21.0
|
57.0
|
75.1
|
136
|
280
|
520
|
982
|
1,370
|
5,410
|
|
74
|
December
|
40.0
|
105
|
146
|
260
|
458
|
788
|
1,300
|
1,810
|
7,170
|
|
74
|
|
|
Instantaneous minimum flow for period of record =
0.22
cubic feet per second.
The current daily value for 03/22/2017 is 822.0 cubic feet per second.
----
Provisional Data Subject to Revision ----
|