|
02011460
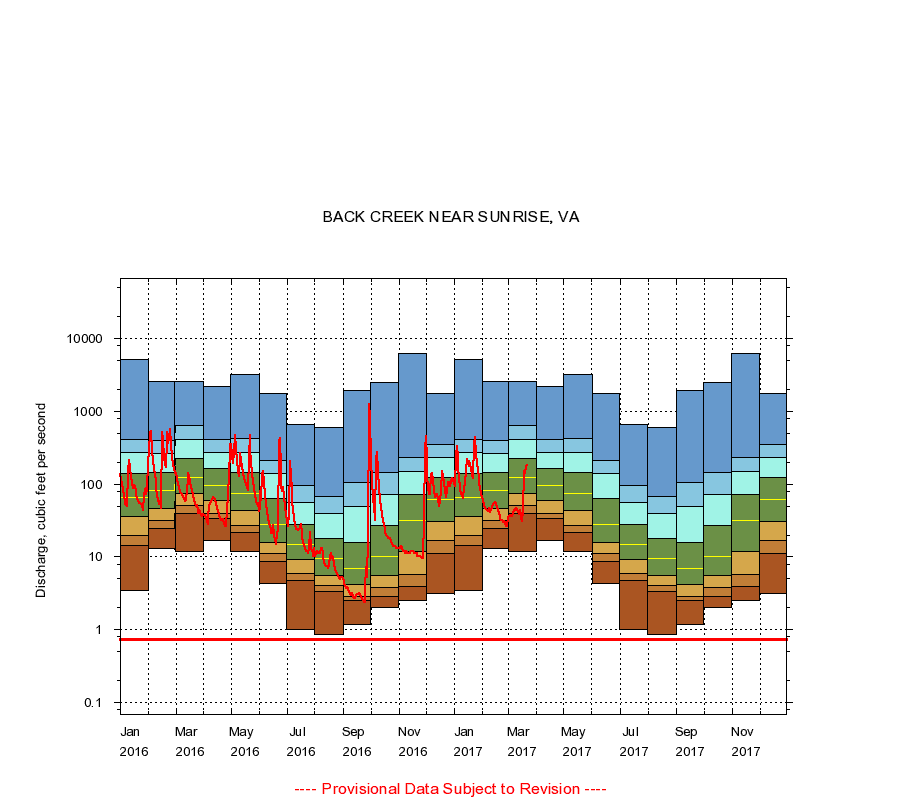
BACK CREEK NEAR SUNRISE, VA
|
Minimum daily flow
|
|
|
5th percentile
|
|
|
|
10th percentile
|
|
|
|
|
25th percentile
|
|
|
|
|
|
Median
|
|
|
|
|
|
|
75th percentile
|
|
|
|
|
|
|
|
90th percentile
|
|
|
|
|
|
|
|
|
95th percentile
|
|
|
|
|
|
|
|
|
|
Maximum daily flow
|
|
|
|
|
|
|
|
|
|
|
|
Years of record
|
January
|
3.50
|
14.6
|
20.0
|
36.0
|
65.0
|
141
|
275
|
416
|
5,230
|
|
41
|
February
|
13.0
|
25.0
|
32.0
|
46.0
|
83.0
|
143
|
264
|
395
|
2,560
|
|
41
|
March
|
12.0
|
40.0
|
51.2
|
75.0
|
125
|
224
|
416
|
635
|
2,610
|
|
41
|
April
|
17.0
|
34.0
|
40.0
|
58.8
|
96.0
|
164
|
273
|
416
|
2,200
|
|
41
|
May
|
12.0
|
22.0
|
27.2
|
44.0
|
74.0
|
143
|
272
|
419
|
3,230
|
|
41
|
June
|
4.30
|
8.60
|
11.0
|
16.0
|
28.0
|
64.0
|
141
|
211
|
1,760
|
|
41
|
July
|
1.00
|
4.70
|
5.90
|
9.10
|
15.0
|
28.0
|
56.0
|
96.0
|
663
|
|
42
|
August
|
0.87
|
3.40
|
4.00
|
5.50
|
9.40
|
18.0
|
40.0
|
68.0
|
595
|
|
42
|
September
|
1.20
|
2.50
|
2.90
|
4.20
|
7.05
|
16.0
|
49.0
|
105
|
1,920
|
|
42
|
October
|
2.00
|
2.90
|
3.80
|
5.60
|
10.0
|
27.0
|
73.0
|
143
|
2,460
|
|
41
|
November
|
2.50
|
3.96
|
5.71
|
12.0
|
32.0
|
73.0
|
149
|
236
|
6,280
|
|
41
|
December
|
3.20
|
11.0
|
17.0
|
31.0
|
61.0
|
124
|
233
|
346
|
1,750
|
|
41
|
|
|
Instantaneous minimum flow for period of record =
0.73
cubic feet per second.
The current daily value for 03/22/2017 is 178.0 cubic feet per second.
----
Provisional Data Subject to Revision ----
|

