|
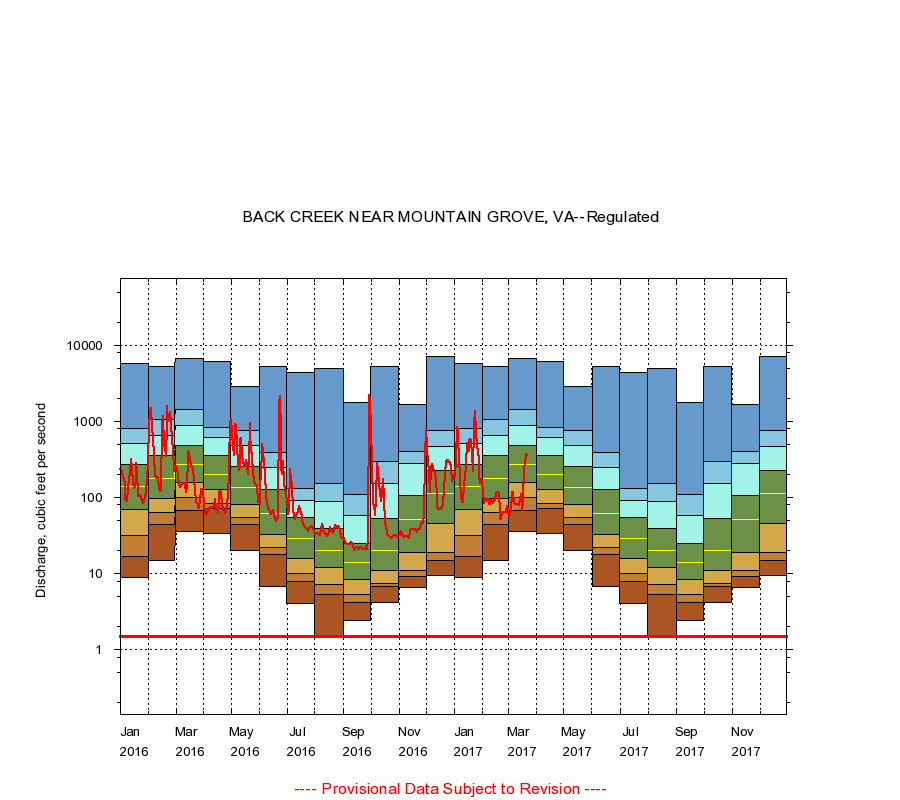
02011500
BACK CREEK NEAR MOUNTAIN GROVE, VA
|
Minimum daily flow
|
|
|
5th percentile
|
|
|
|
10th percentile
|
|
|
|
|
25th percentile
|
|
|
|
|
|
Median
|
|
|
|
|
|
|
75th percentile
|
|
|
|
|
|
|
|
90th percentile
|
|
|
|
|
|
|
|
|
95th percentile
|
|
|
|
|
|
|
|
|
|
Maximum daily flow
|
|
|
|
|
|
|
|
|
|
|
|
Years of record
|
January
|
8.80
|
17.0
|
32.0
|
70.0
|
138
|
272
|
515
|
818
|
5,860
|
|
33
|
February
|
15.0
|
44.7
|
63.0
|
96.0
|
177
|
352
|
660
|
1,050
|
5,220
|
|
33
|
March
|
36.0
|
67.0
|
100
|
159
|
275
|
486
|
895
|
1,430
|
6,670
|
|
33
|
April
|
34.0
|
71.0
|
84.0
|
126
|
204
|
354
|
619
|
831
|
6,100
|
|
33
|
May
|
20.0
|
44.2
|
54.4
|
81.0
|
134
|
254
|
488
|
756
|
2,840
|
|
33
|
June
|
6.70
|
18.0
|
22.1
|
33.0
|
62.0
|
128
|
246
|
391
|
5,340
|
|
33
|
July
|
4.00
|
7.92
|
10.0
|
16.0
|
29.0
|
54.0
|
92.4
|
132
|
4,370
|
|
33
|
August
|
1.50
|
5.40
|
7.10
|
12.0
|
20.0
|
39.0
|
88.6
|
155
|
4,920
|
|
33
|
September
|
2.40
|
4.20
|
5.40
|
8.50
|
14.0
|
25.0
|
58.0
|
110
|
1,750
|
|
33
|
October
|
4.20
|
6.80
|
7.50
|
11.0
|
20.0
|
53.0
|
154
|
302
|
5,330
|
|
33
|
November
|
6.60
|
9.31
|
11.0
|
19.0
|
51.0
|
106
|
280
|
406
|
1,660
|
|
33
|
December
|
9.40
|
15.0
|
19.0
|
46.0
|
113
|
225
|
464
|
766
|
7,110
|
|
33
|
|
|
Instantaneous minimum flow for period of record =
1.50
cubic feet per second.
The current daily value for 03/22/2017 is 361.0 cubic feet per second.
----
Provisional Data Subject to Revision ----
|