|
02024000
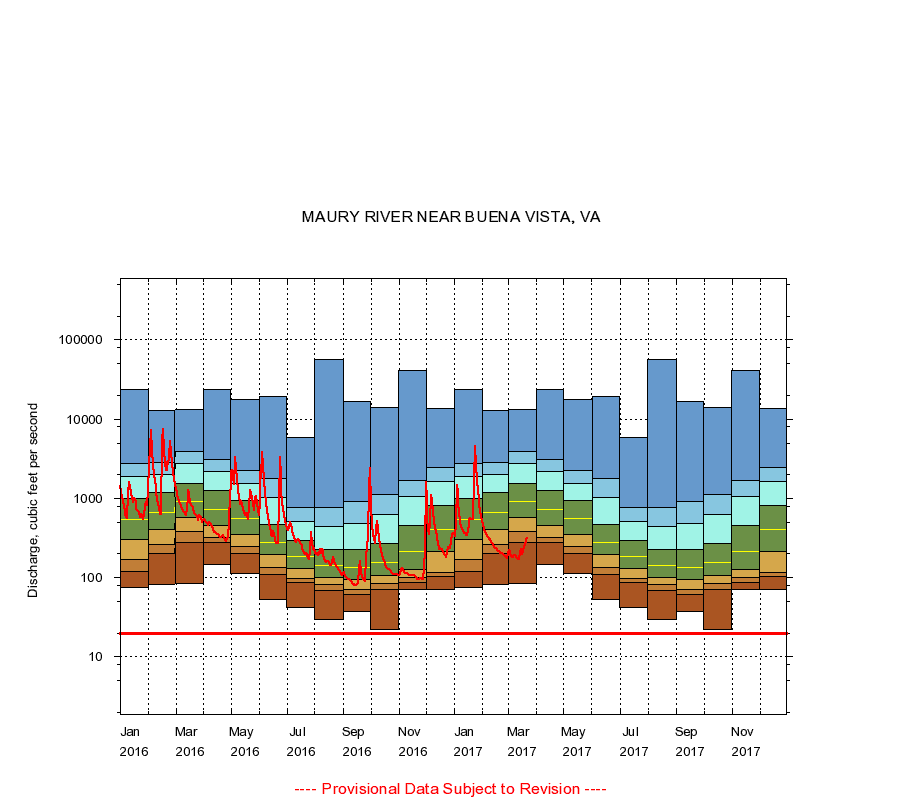
MAURY RIVER NEAR BUENA VISTA, VA
|
Minimum daily flow
|
|
|
5th percentile
|
|
|
|
10th percentile
|
|
|
|
|
25th percentile
|
|
|
|
|
|
Median
|
|
|
|
|
|
|
75th percentile
|
|
|
|
|
|
|
|
90th percentile
|
|
|
|
|
|
|
|
|
95th percentile
|
|
|
|
|
|
|
|
|
|
Maximum daily flow
|
|
|
|
|
|
|
|
|
|
|
|
Years of record
|
January
|
75.0
|
119
|
170
|
300
|
536
|
1,000
|
1,910
|
2,750
|
23,600
|
|
77
|
February
|
81.0
|
201
|
262
|
404
|
668
|
1,200
|
2,030
|
2,870
|
12,700
|
|
77
|
March
|
84.0
|
276
|
378
|
572
|
910
|
1,550
|
2,740
|
3,910
|
13,100
|
|
77
|
April
|
148
|
278
|
324
|
450
|
716
|
1,270
|
2,200
|
3,070
|
23,400
|
|
77
|
May
|
114
|
204
|
246
|
351
|
554
|
935
|
1,550
|
2,270
|
17,800
|
|
77
|
June
|
53.0
|
111
|
136
|
194
|
281
|
476
|
1,020
|
1,760
|
19,600
|
|
77
|
July
|
42.0
|
86.0
|
97.0
|
130
|
184
|
294
|
507
|
758
|
5,790
|
|
77
|
August
|
30.0
|
69.0
|
81.0
|
102
|
141
|
224
|
438
|
766
|
56,000
|
|
77
|
September
|
38.0
|
62.0
|
72.0
|
95.0
|
134
|
229
|
480
|
921
|
16,900
|
|
77
|
October
|
22.0
|
71.4
|
85.0
|
107
|
156
|
268
|
623
|
1,120
|
13,900
|
|
77
|
November
|
71.0
|
88.0
|
100
|
127
|
214
|
454
|
1,060
|
1,690
|
41,200
|
|
77
|
December
|
70.0
|
103
|
118
|
216
|
410
|
818
|
1,620
|
2,450
|
13,600
|
|
77
|
|
|
Instantaneous minimum flow for period of record =
20.0
cubic feet per second.
The current daily value for 03/22/2017 is 308.0 cubic feet per second.
----
Provisional Data Subject to Revision ----
|