|
02028500
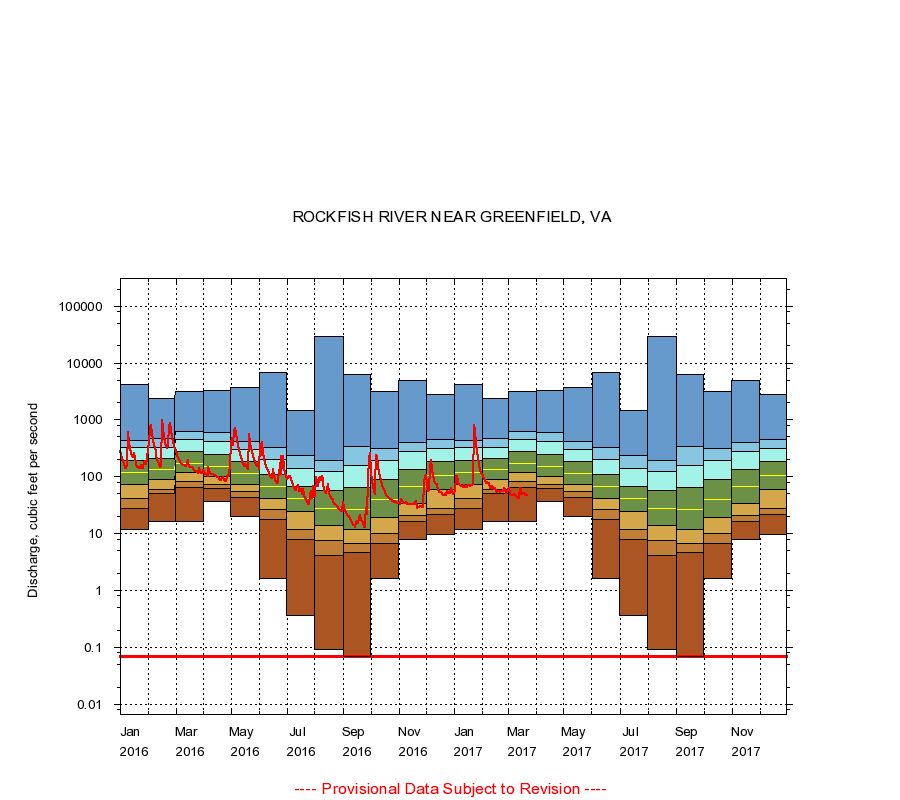
ROCKFISH RIVER NEAR GREENFIELD, VA
|
Minimum daily flow
|
|
|
5th percentile
|
|
|
|
10th percentile
|
|
|
|
|
25th percentile
|
|
|
|
|
|
Median
|
|
|
|
|
|
|
75th percentile
|
|
|
|
|
|
|
|
90th percentile
|
|
|
|
|
|
|
|
|
95th percentile
|
|
|
|
|
|
|
|
|
|
Maximum daily flow
|
|
|
|
|
|
|
|
|
|
|
|
Years of record
|
January
|
12.0
|
28.0
|
41.0
|
74.0
|
120
|
194
|
324
|
442
|
4,140
|
|
72
|
February
|
16.0
|
49.8
|
59.0
|
88.8
|
136
|
208
|
332
|
466
|
2,330
|
|
72
|
March
|
16.0
|
64.0
|
81.0
|
120
|
169
|
277
|
450
|
634
|
3,110
|
|
72
|
April
|
36.0
|
62.0
|
74.1
|
102
|
150
|
246
|
422
|
594
|
3,250
|
|
73
|
May
|
20.0
|
43.0
|
54.0
|
74.0
|
116
|
184
|
303
|
416
|
3,690
|
|
73
|
June
|
1.60
|
18.0
|
26.0
|
42.0
|
68.0
|
110
|
202
|
327
|
6,940
|
|
73
|
July
|
0.37
|
8.00
|
12.0
|
24.0
|
41.0
|
67.0
|
137
|
240
|
1,460
|
|
73
|
August
|
0.09
|
4.20
|
7.50
|
14.0
|
28.0
|
58.0
|
124
|
193
|
28,800
|
|
73
|
September
|
0.07
|
4.70
|
6.80
|
12.0
|
27.0
|
64.0
|
158
|
340
|
6,370
|
|
73
|
October
|
1.60
|
6.66
|
10.0
|
19.0
|
39.0
|
90.0
|
196
|
317
|
3,180
|
|
72
|
November
|
8.00
|
16.0
|
21.0
|
34.0
|
66.0
|
133
|
275
|
400
|
5,000
|
|
72
|
December
|
9.60
|
22.0
|
28.0
|
60.0
|
106
|
182
|
316
|
451
|
2,740
|
|
72
|
|
|
Instantaneous minimum flow for period of record =
0.07
cubic feet per second.
The current daily value for 03/22/2017 is 46.0 cubic feet per second.
----
Provisional Data Subject to Revision ----
|