|
02042500
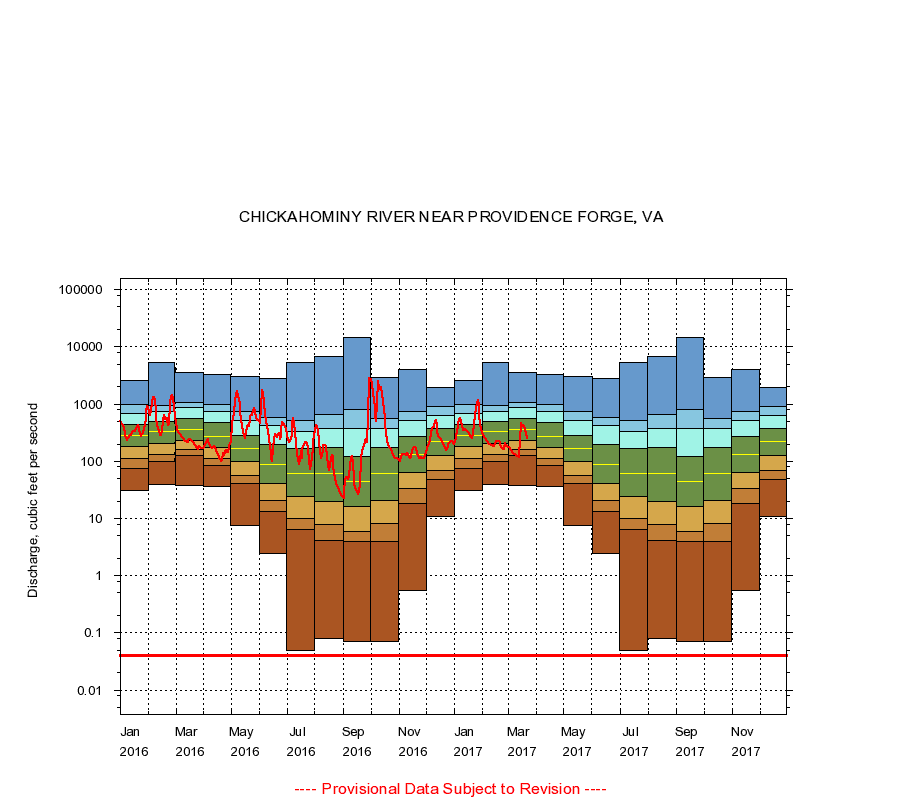
CHICKAHOMINY RIVER NEAR PROVIDENCE FORGE, VA
|
Minimum daily flow
|
|
|
5th percentile
|
|
|
|
10th percentile
|
|
|
|
|
25th percentile
|
|
|
|
|
|
Median
|
|
|
|
|
|
|
75th percentile
|
|
|
|
|
|
|
|
90th percentile
|
|
|
|
|
|
|
|
|
95th percentile
|
|
|
|
|
|
|
|
|
|
Maximum daily flow
|
|
|
|
|
|
|
|
|
|
|
|
Years of record
|
January
|
31.0
|
74.0
|
111
|
184
|
286
|
435
|
683
|
1,000
|
2,580
|
|
74
|
February
|
39.0
|
99.6
|
130
|
208
|
335
|
500
|
755
|
955
|
5,270
|
|
74
|
March
|
37.0
|
124
|
162
|
229
|
359
|
551
|
862
|
1,060
|
3,570
|
|
74
|
April
|
36.0
|
86.0
|
113
|
176
|
275
|
473
|
740
|
989
|
3,250
|
|
74
|
May
|
7.60
|
41.0
|
57.0
|
100
|
168
|
285
|
511
|
742
|
3,000
|
|
74
|
June
|
2.40
|
13.0
|
21.0
|
41.0
|
87.0
|
193
|
414
|
576
|
2,820
|
|
74
|
July
|
0.05
|
6.30
|
10.0
|
24.0
|
61.0
|
165
|
335
|
506
|
5,350
|
|
74
|
August
|
0.08
|
4.10
|
7.85
|
20.0
|
62.0
|
173
|
380
|
656
|
6,680
|
|
74
|
September
|
0.07
|
4.00
|
6.00
|
16.0
|
44.0
|
119
|
379
|
810
|
14,700
|
|
74
|
October
|
0.07
|
4.00
|
8.34
|
21.0
|
62.0
|
177
|
372
|
550
|
2,900
|
|
73
|
November
|
0.55
|
18.0
|
33.0
|
63.0
|
130
|
266
|
526
|
752
|
3,980
|
|
73
|
December
|
11.0
|
48.0
|
69.4
|
125
|
225
|
368
|
620
|
890
|
1,930
|
|
73
|
|
|
Instantaneous minimum flow for period of record =
0.04
cubic feet per second.
The current daily value for 03/22/2017 is 255.0 cubic feet per second.
----
Provisional Data Subject to Revision ----
|