|
02058400
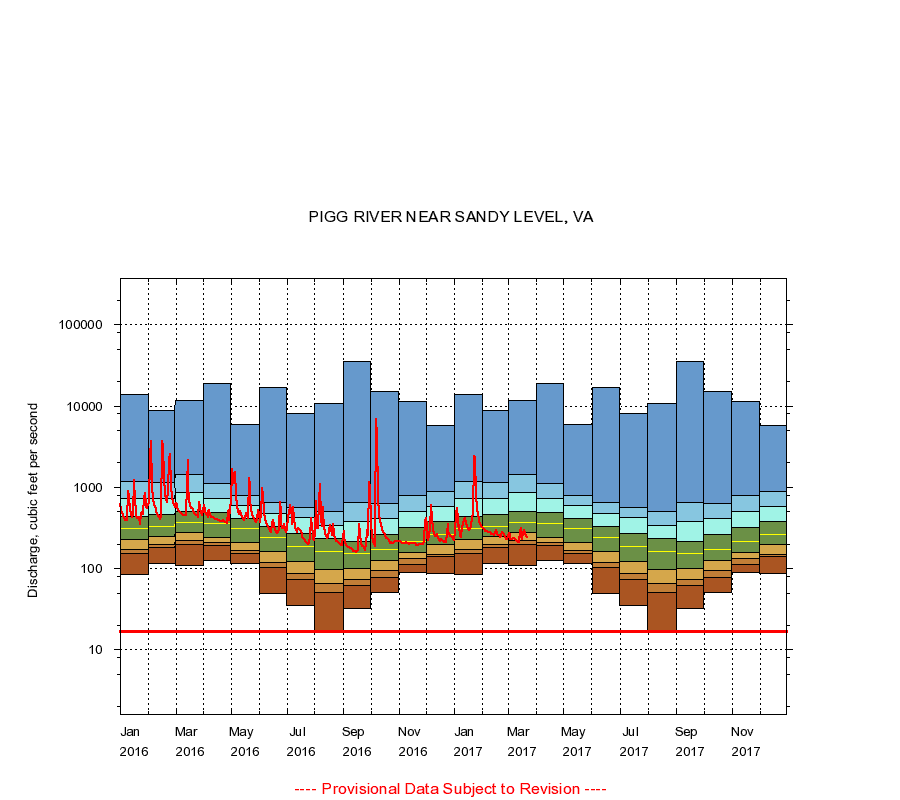
PIGG RIVER NEAR SANDY LEVEL, VA
|
Minimum daily flow
|
|
|
5th percentile
|
|
|
|
10th percentile
|
|
|
|
|
25th percentile
|
|
|
|
|
|
Median
|
|
|
|
|
|
|
75th percentile
|
|
|
|
|
|
|
|
90th percentile
|
|
|
|
|
|
|
|
|
95th percentile
|
|
|
|
|
|
|
|
|
|
Maximum daily flow
|
|
|
|
|
|
|
|
|
|
|
|
Years of record
|
January
|
85.0
|
152
|
173
|
226
|
315
|
439
|
722
|
1,180
|
13,800
|
|
52
|
February
|
114
|
180
|
199
|
249
|
330
|
468
|
721
|
1,140
|
8,710
|
|
52
|
March
|
109
|
196
|
223
|
274
|
367
|
508
|
857
|
1,440
|
11,600
|
|
52
|
April
|
124
|
191
|
207
|
240
|
354
|
486
|
730
|
1,100
|
19,200
|
|
52
|
May
|
117
|
153
|
168
|
212
|
308
|
418
|
590
|
794
|
6,000
|
|
52
|
June
|
50.0
|
102
|
119
|
162
|
244
|
331
|
471
|
645
|
17,000
|
|
53
|
July
|
35.0
|
73.0
|
87.4
|
121
|
187
|
270
|
421
|
559
|
8,180
|
|
53
|
August
|
17.0
|
51.0
|
65.0
|
98.0
|
161
|
233
|
341
|
501
|
10,600
|
|
53
|
September
|
32.0
|
61.0
|
74.0
|
100
|
153
|
218
|
380
|
654
|
34,900
|
|
53
|
October
|
51.0
|
78.0
|
95.0
|
126
|
171
|
262
|
417
|
639
|
15,200
|
|
52
|
November
|
89.0
|
111
|
132
|
157
|
213
|
320
|
503
|
796
|
11,400
|
|
52
|
December
|
86.0
|
140
|
150
|
197
|
266
|
384
|
583
|
882
|
5,840
|
|
52
|
|
|
Instantaneous minimum flow for period of record =
17.0
cubic feet per second.
The current daily value for 03/22/2017 is 242.0 cubic feet per second.
----
Provisional Data Subject to Revision ----
|