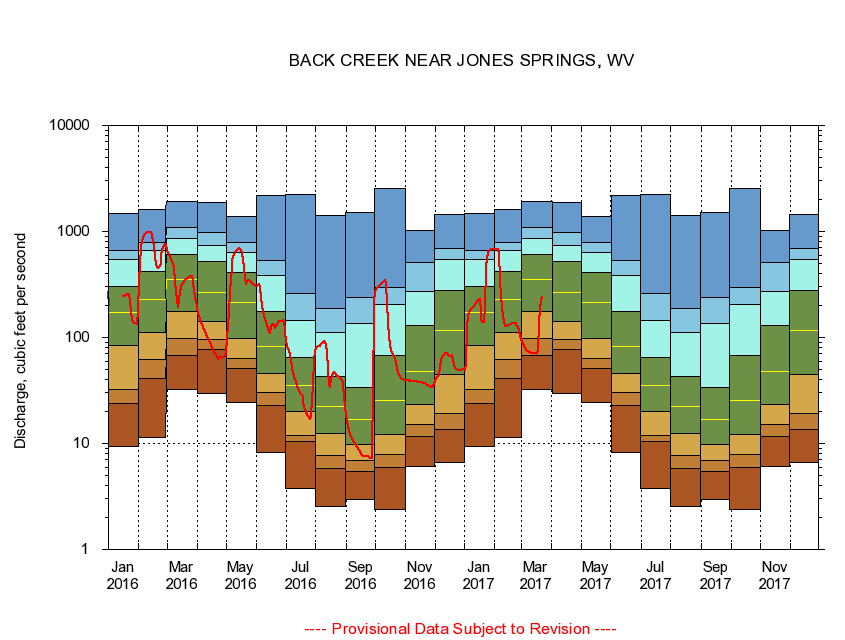
USGS - science for a changing world
Virginia DEQ

Virginia Water Science Center

 
  Duration Plot and Table of 14-Day Average Streamflow
 
01614000 BACK CREEK NEAR JONES SPRINGS, WV
LOCATION.--Latitude 39°30'43", Longitude 78°02'15", North American Datum of 1927
                    Berkeley County, W. Va., Hydrologic Unit 02070004.
DRAINAGE AREA.--235 square miles.
PERIOD OF RECORD.--July 1928 to September 1931, August 1938 to September 1975, June 2004 to current year.
DURATION STATISTIC COMPUTATION PERIOD.--All data through September 2015.
REGULATION.--No known regulation.
GAGE OPERATION.--U.S. Geological Survey, West Virginia Water Science Center.

     Duration Plot with 14-Day Average Streamflow Conditions
Provisional Data Subject to Revision
01614000 plot. 
BACK CREEK NEAR JONES SPRINGS, WV
Provisional Data Subject to Revision


The current 14-day running-average value for 03/22/2017 is 236.36 cubic feet per second.

  explanation   Percentile Description Duration Plot Description 28 Day 14 Day 7 Day Daily


      Duration Table of 14-Day Average Streamflow
           
Flow values in cubic feet per second


                01614000     BACK CREEK NEAR JONES SPRINGS, WV

   Minimum daily flow
   5th percentile
 
   10th percentile
 
   25th percentile
 
 
   Median
 
 
   75th percentile


   90th percentile


   95th percentile


   Maximum daily flow
         
Years of record
January
9.29
24.0
32.4
84.9
174
305
540
655
1,490
 
51
February
11.4
41.1
61.8
112
227
419
668
795
1,620
 
51
March
32.4
67.6
98.4
177
352
601
865
1,090
1,900
 
51
April
29.4
76.3
95.5
143
268
523
737
970
1,860
 
51
May
24.6
51.4
63.2
97.6
214
412
636
792
1,400
 
51
June
8.27
22.7
30.0
46.0
82.6
176
385
536
2,170
 
51
July
3.79
10.4
11.8
19.9
35.6
64.9
146
262
2,240
 
51
August
2.54
5.83
7.74
12.4
22.1
42.7
112
189
1,410
 
52
September
2.98
5.45
6.97
9.69
16.7
34.0
135
239
1,500
 
52
October
2.37
5.91
7.91
12.1
25.7
68.1
204
299
2,570
 
50
November
6.05
11.6
15.0
23.1
47.7
129
270
511
1,030
 
51
December
6.66
13.7
19.1
45.2
117
280
545
689
1,440
 
51


The current 14-day running-average value for 03/22/2017 is 236.36 cubic feet per second.

---- Provisional Data Subject to Revision ----

Accessibility FOIA Privacy Policies and Notices

Take Pride in America logo USA.gov logo U.S. Department of the Interior | U.S. Geological Survey
URL: http://va.water.usgs.gov/duration_plots/htm_14/dp01614000.htm
Page Contact Information: Virginia WSC Webmaster
Page Last Modified: 6/19/2016