|
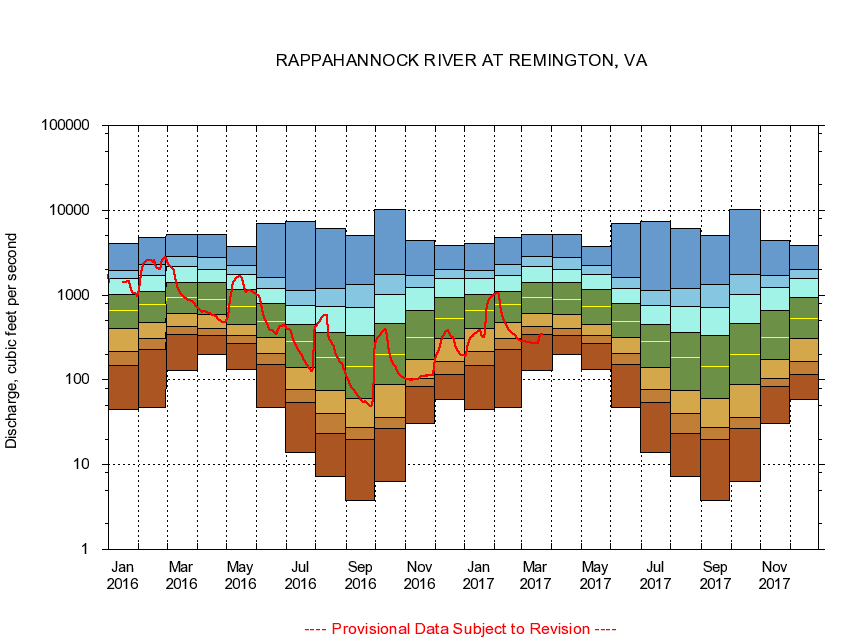
01664000
RAPPAHANNOCK RIVER AT REMINGTON, VA
|
Minimum daily flow
|
|
|
5th percentile
|
|
|
|
10th percentile
|
|
|
|
|
25th percentile
|
|
|
|
|
|
Median
|
|
|
|
|
|
|
75th percentile
|
|
|
|
|
|
|
|
90th percentile
|
|
|
|
|
|
|
|
|
95th percentile
|
|
|
|
|
|
|
|
|
|
Maximum daily flow
|
|
|
|
|
|
|
|
|
|
|
|
Years of record
|
January
|
45.1
|
146
|
214
|
407
|
658
|
1,030
|
1,590
|
1,930
|
4,030
|
|
73
|
February
|
46.7
|
231
|
309
|
476
|
773
|
1,100
|
1,690
|
2,320
|
4,840
|
|
73
|
March
|
129
|
339
|
425
|
611
|
936
|
1,390
|
2,200
|
2,850
|
5,220
|
|
73
|
April
|
200
|
333
|
400
|
583
|
884
|
1,420
|
2,000
|
2,760
|
5,160
|
|
73
|
May
|
133
|
266
|
330
|
449
|
734
|
1,150
|
1,750
|
2,230
|
3,770
|
|
73
|
June
|
47.6
|
151
|
207
|
315
|
486
|
793
|
1,210
|
1,620
|
6,900
|
|
73
|
July
|
14.0
|
54.7
|
77.6
|
139
|
287
|
452
|
756
|
1,130
|
7,380
|
|
73
|
August
|
7.26
|
23.1
|
40.6
|
75.5
|
183
|
365
|
736
|
1,210
|
6,040
|
|
73
|
September
|
3.74
|
19.7
|
27.2
|
59.8
|
143
|
332
|
714
|
1,330
|
4,990
|
|
73
|
October
|
6.31
|
27.0
|
36.3
|
87.4
|
200
|
467
|
1,020
|
1,730
|
10,100
|
|
72
|
November
|
30.6
|
83.4
|
105
|
172
|
320
|
659
|
1,220
|
1,680
|
4,410
|
|
73
|
December
|
59.4
|
117
|
167
|
308
|
534
|
929
|
1,570
|
2,020
|
3,890
|
|
73
|
|
|
|