|
01672500
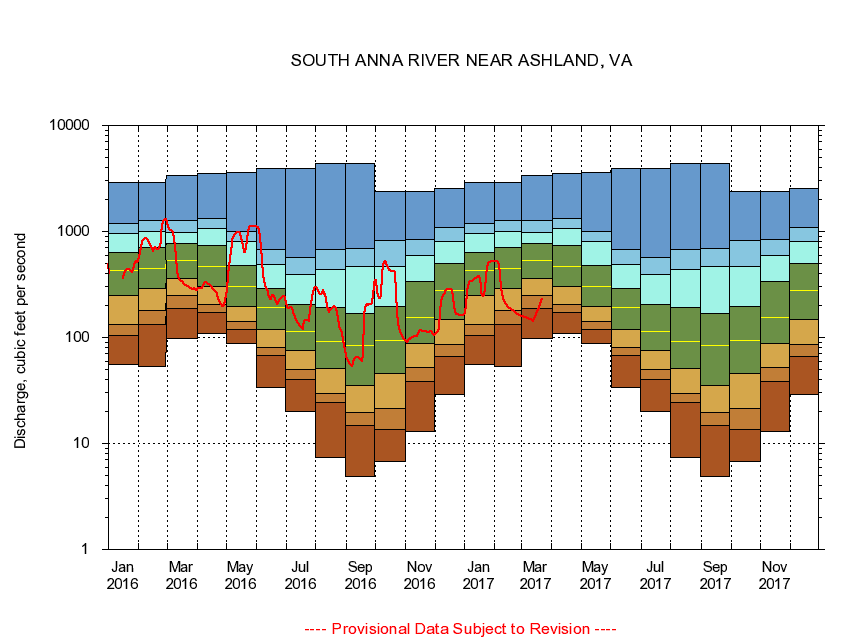
SOUTH ANNA RIVER NEAR ASHLAND, VA
|
Minimum daily flow
|
|
|
5th percentile
|
|
|
|
10th percentile
|
|
|
|
|
25th percentile
|
|
|
|
|
|
Median
|
|
|
|
|
|
|
75th percentile
|
|
|
|
|
|
|
|
90th percentile
|
|
|
|
|
|
|
|
|
95th percentile
|
|
|
|
|
|
|
|
|
|
Maximum daily flow
|
|
|
|
|
|
|
|
|
|
|
|
Years of record
|
January
|
55.4
|
104
|
132
|
250
|
424
|
632
|
965
|
1,200
|
2,880
|
|
79
|
February
|
52.8
|
132
|
181
|
288
|
452
|
701
|
1,010
|
1,260
|
2,900
|
|
79
|
March
|
97.0
|
188
|
247
|
361
|
527
|
774
|
988
|
1,280
|
3,360
|
|
79
|
April
|
108
|
172
|
206
|
306
|
464
|
739
|
1,060
|
1,320
|
3,530
|
|
79
|
May
|
87.7
|
119
|
143
|
198
|
301
|
473
|
807
|
991
|
3,620
|
|
79
|
June
|
33.5
|
68.3
|
81.2
|
118
|
190
|
287
|
485
|
671
|
3,900
|
|
79
|
July
|
19.9
|
40.0
|
50.0
|
74.8
|
113
|
206
|
394
|
566
|
3,950
|
|
79
|
August
|
7.43
|
24.6
|
29.4
|
51.3
|
92.4
|
190
|
437
|
681
|
4,390
|
|
80
|
September
|
4.86
|
14.9
|
19.5
|
35.1
|
84.7
|
170
|
464
|
697
|
4,360
|
|
80
|
October
|
6.73
|
13.7
|
21.5
|
46.2
|
93.0
|
197
|
466
|
821
|
2,370
|
|
78
|
November
|
13.0
|
38.7
|
51.6
|
87.7
|
154
|
335
|
600
|
847
|
2,400
|
|
79
|
December
|
29.1
|
65.6
|
85.8
|
148
|
278
|
498
|
803
|
1,080
|
2,540
|
|
79
|
|
|
|