USGS - science for a changing world
Virginia DEQ

Virginia Water Science Center

 
  Duration Plot and Table of 14-Day Average Streamflow
 
02016000 COWPASTURE RIVER NEAR CLIFTON FORGE, VA
LOCATION.--Latitude 37°47'30", Longitude 79°45'35", North American Datum of 1927,
                    Alleghany County, VA, Hydrologic Unit 02080201.
DRAINAGE AREA.--461 square miles.
PERIOD OF RECORD.--March 1925 to current year. Records for May 1907 to August 1908, published in WSP 242, are unreliable and should not be used.
DURATION STATISTIC COMPUTATION PERIOD.--All data through September 2015.
REGULATION.--Occasional withdrawal of water during summer months for the filling of swimming pool at camp 10 to 15 miles above gage.
GAGE OPERATION.--U.S. Geological Survey, Virginia Water Science Center.

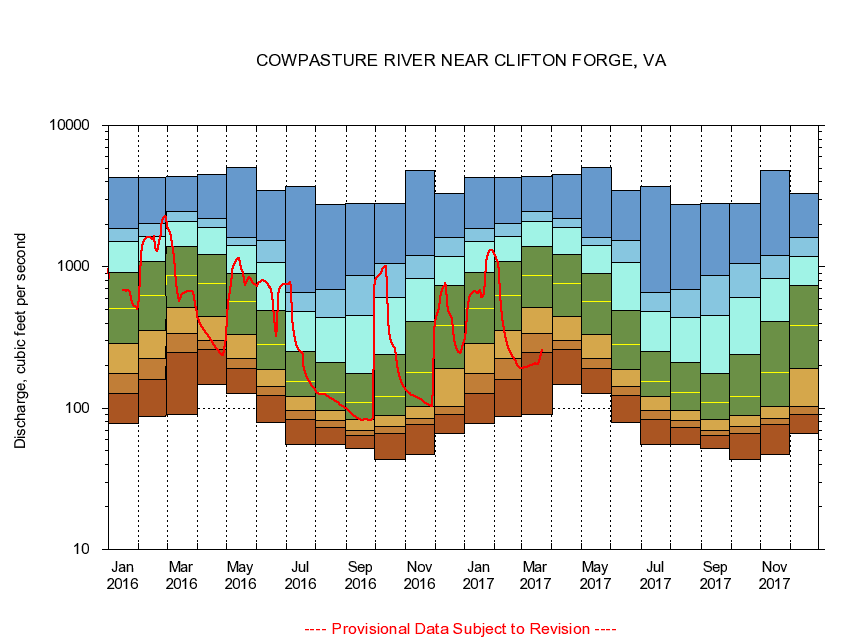
     Duration Plot with 14-Day Average Streamflow Conditions
Provisional Data Subject to Revision
02016000 plot. 
COWPASTURE RIVER NEAR CLIFTON FORGE, VA
Provisional Data Subject to Revision


The current 14-day running-average value for 03/22/2017 is 254.57 cubic feet per second.

  explanation   Percentile Description Duration Plot Description 28 Day 14 Day 7 Day Daily


      Duration Table of 14-Day Average Streamflow
           
Flow values in cubic feet per second


                02016000     COWPASTURE RIVER NEAR CLIFTON FORGE, VA

   Minimum daily flow
   5th percentile
 
   10th percentile
 
   25th percentile
 
 
   Median
 
 
   75th percentile


   90th percentile


   95th percentile


   Maximum daily flow
         
Years of record
January
77.6
126
175
285
504
914
1,510
1,870
4,310
 
90
February
87.7
159
224
354
624
1,090
1,650
2,010
4,270
 
90
March
89.9
249
335
517
871
1,400
2,080
2,470
4,340
 
90
April
148
258
301
444
757
1,230
1,900
2,210
4,480
 
90
May
127
191
225
330
568
901
1,410
1,620
5,080
 
90
June
79.6
123
142
187
282
490
1,080
1,540
3,460
 
90
July
55.7
83.4
96.4
120
154
250
486
661
3,730
 
90
August
55.1
73.2
81.2
96.8
129
209
441
695
2,760
 
90
September
51.5
64.4
69.8
83.1
109
177
451
875
2,800
 
90
October
43.1
66.1
74.5
88.7
120
238
602
1,050
2,820
 
89
November
47.0
77.2
84.6
103
178
408
830
1,200
4,820
 
90
December
66.3
90.4
102
192
385
736
1,180
1,610
3,320
 
90


The current 14-day running-average value for 03/22/2017 is 254.57 cubic feet per second.

---- Provisional Data Subject to Revision ----

Accessibility FOIA Privacy Policies and Notices

Take Pride in America logo USA.gov logo U.S. Department of the Interior | U.S. Geological Survey
URL: http://va.water.usgs.gov/duration_plots/htm_14/dp02016000.htm
Page Contact Information: Virginia WSC Webmaster
Page Last Modified: 6/19/2016