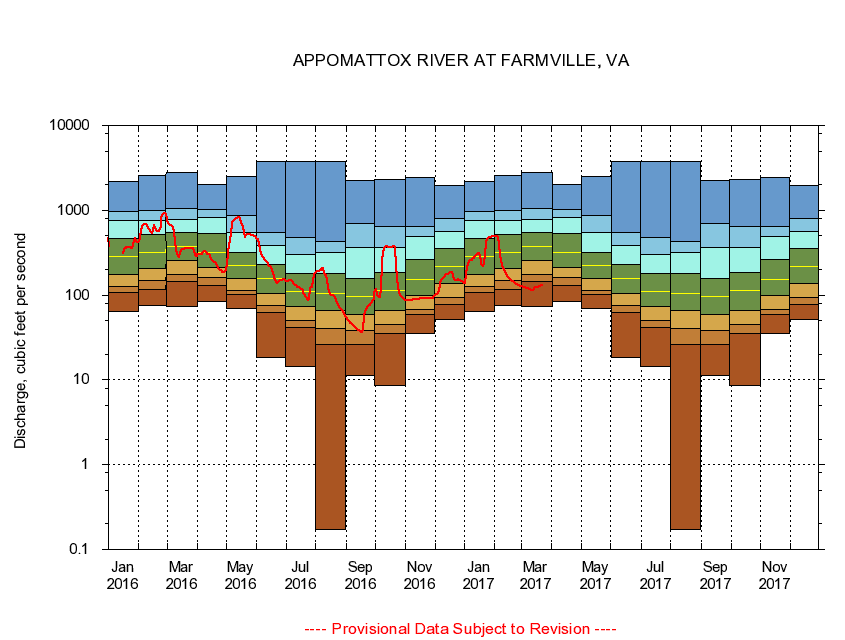
USGS - science for a changing world
Virginia DEQ

Virginia Water Science Center

 
  Duration Plot and Table of 14-Day Average Streamflow
 
02039500 APPOMATTOX RIVER AT FARMVILLE, VA
LOCATION.--Latitude 37°18'25", Longitude 78°23'20", North American Datum of 1927,
                    Cumberland County, VA, Hydrologic Unit 02080207.
DRAINAGE AREA.--302 square miles.
PERIOD OF RECORD.--March 1926 to current year.
DURATION STATISTIC COMPUTATION PERIOD.--All data through September 2015.
REGULATION.--Diurnal fluctuation at low flow caused by mill and disposal plant above station.
GAGE OPERATION.--Virginia Department of Environmental Quality - Water Division.

     Duration Plot with 14-Day Average Streamflow Conditions
Provisional Data Subject to Revision
02039500 plot. 
APPOMATTOX RIVER AT FARMVILLE, VA
Provisional Data Subject to Revision


The current 14-day running-average value for 03/22/2017 is 129.79 cubic feet per second.

  explanation   Percentile Description Duration Plot Description 28 Day 14 Day 7 Day Daily


      Duration Table of 14-Day Average Streamflow
           
Flow values in cubic feet per second


                02039500     APPOMATTOX RIVER AT FARMVILLE, VA

   Minimum daily flow
   5th percentile
 
   10th percentile
 
   25th percentile
 
 
   Median
 
 
   75th percentile


   90th percentile


   95th percentile


   Maximum daily flow
         
Years of record
January
63.6
106
125
176
288
462
753
968
2,160
 
89
February
76.4
118
147
207
320
520
750
1,000
2,540
 
89
March
73.9
145
174
253
371
549
770
1,050
2,820
 
89
April
84.1
131
163
212
322
532
813
1,030
2,020
 
89
May
70.1
103
114
159
222
319
548
865
2,510
 
90
June
18.2
62.5
74.4
105
158
227
383
546
3,740
 
90
July
14.3
41.8
50.5
74.2
111
178
300
473
3,760
 
90
August
0.17
26.4
40.9
66.6
104
182
315
429
3,750
 
90
September
11.2
25.9
38.6
58.4
95.1
156
368
698
2,270
 
90
October
8.55
35.4
45.4
65.6
112
186
362
645
2,290
 
89
November
34.9
58.9
67.6
100
154
261
491
650
2,410
 
89
December
51.1
76.9
92.5
136
218
352
566
805
1,980
 
89


The current 14-day running-average value for 03/22/2017 is 129.79 cubic feet per second.

---- Provisional Data Subject to Revision ----

Accessibility FOIA Privacy Policies and Notices

Take Pride in America logo USA.gov logo U.S. Department of the Interior | U.S. Geological Survey
URL: http://va.water.usgs.gov/duration_plots/htm_14/dp02039500.htm
Page Contact Information: Virginia WSC Webmaster
Page Last Modified: 6/19/2016