|
02044500
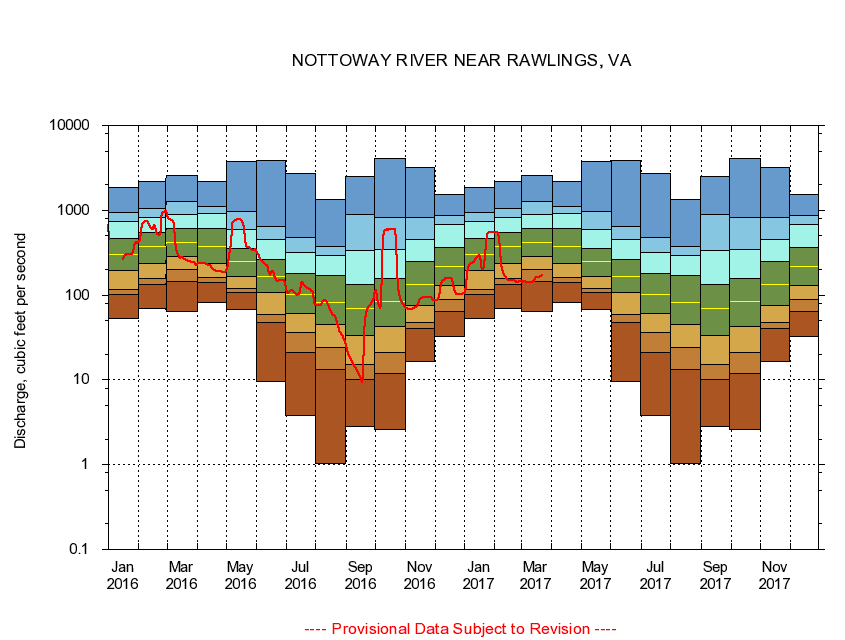
NOTTOWAY RIVER NEAR RAWLINGS, VA
|
Minimum daily flow
|
|
|
5th percentile
|
|
|
|
10th percentile
|
|
|
|
|
25th percentile
|
|
|
|
|
|
Median
|
|
|
|
|
|
|
75th percentile
|
|
|
|
|
|
|
|
90th percentile
|
|
|
|
|
|
|
|
|
95th percentile
|
|
|
|
|
|
|
|
|
|
Maximum daily flow
|
|
|
|
|
|
|
|
|
|
|
|
Years of record
|
January
|
53.4
|
102
|
118
|
196
|
299
|
467
|
744
|
937
|
1,880
|
|
65
|
February
|
68.6
|
132
|
157
|
233
|
376
|
545
|
820
|
1,050
|
2,200
|
|
65
|
March
|
64.9
|
145
|
202
|
289
|
413
|
610
|
903
|
1,270
|
2,550
|
|
65
|
April
|
81.1
|
140
|
160
|
236
|
372
|
609
|
913
|
1,100
|
2,210
|
|
65
|
May
|
67.6
|
106
|
120
|
165
|
249
|
354
|
589
|
962
|
3,810
|
|
65
|
June
|
9.51
|
47.5
|
59.8
|
106
|
166
|
261
|
448
|
638
|
3,820
|
|
65
|
July
|
3.81
|
21.2
|
36.4
|
60.3
|
101
|
179
|
320
|
484
|
2,740
|
|
65
|
August
|
1.03
|
13.4
|
24.3
|
45.2
|
81.6
|
172
|
290
|
370
|
1,350
|
|
65
|
September
|
2.84
|
10.1
|
15.2
|
33.8
|
70.1
|
135
|
333
|
884
|
2,530
|
|
65
|
October
|
2.61
|
11.8
|
20.9
|
43.1
|
83.7
|
158
|
342
|
830
|
4,130
|
|
64
|
November
|
16.4
|
39.9
|
47.6
|
75.6
|
132
|
249
|
451
|
812
|
3,210
|
|
65
|
December
|
32.4
|
64.9
|
89.1
|
129
|
218
|
363
|
679
|
858
|
1,520
|
|
65
|
|
|
|