|
02049500
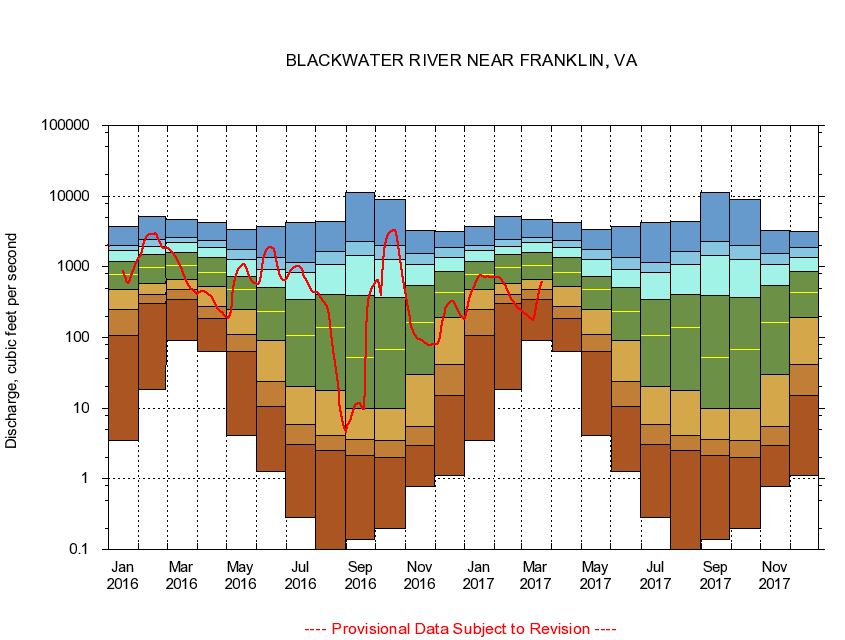
BLACKWATER RIVER NEAR FRANKLIN, VA
|
Minimum daily flow
|
|
|
5th percentile
|
|
|
|
10th percentile
|
|
|
|
|
25th percentile
|
|
|
|
|
|
Median
|
|
|
|
|
|
|
75th percentile
|
|
|
|
|
|
|
|
90th percentile
|
|
|
|
|
|
|
|
|
95th percentile
|
|
|
|
|
|
|
|
|
|
Maximum daily flow
|
|
|
|
|
|
|
|
|
|
|
|
Years of record
|
January
|
3.51
|
108
|
253
|
480
|
769
|
1,200
|
1,710
|
1,980
|
3,670
|
|
71
|
February
|
18.1
|
303
|
400
|
574
|
991
|
1,510
|
1,950
|
2,440
|
5,160
|
|
71
|
March
|
91.0
|
345
|
471
|
662
|
1,030
|
1,590
|
2,180
|
2,580
|
4,650
|
|
71
|
April
|
62.8
|
183
|
277
|
524
|
840
|
1,350
|
1,850
|
2,330
|
4,200
|
|
71
|
May
|
4.06
|
64.1
|
109
|
251
|
476
|
737
|
1,250
|
1,770
|
3,360
|
|
71
|
June
|
1.27
|
10.7
|
23.5
|
90.5
|
234
|
512
|
916
|
1,350
|
3,750
|
|
71
|
July
|
0.28
|
3.03
|
5.92
|
20.1
|
107
|
350
|
843
|
1,140
|
4,200
|
|
71
|
August
|
0.00
|
2.48
|
4.17
|
18.0
|
139
|
410
|
1,070
|
1,640
|
4,370
|
|
71
|
September
|
0.14
|
2.11
|
3.65
|
9.91
|
52.7
|
397
|
1,460
|
2,290
|
11,300
|
|
71
|
October
|
0.20
|
1.99
|
3.45
|
9.91
|
67.4
|
366
|
1,250
|
1,980
|
9,070
|
|
71
|
November
|
0.79
|
3.00
|
5.57
|
29.5
|
165
|
550
|
1,090
|
1,550
|
3,320
|
|
71
|
December
|
1.12
|
15.2
|
41.4
|
192
|
434
|
867
|
1,370
|
1,870
|
3,180
|
|
71
|
|
|
|