|
03167000
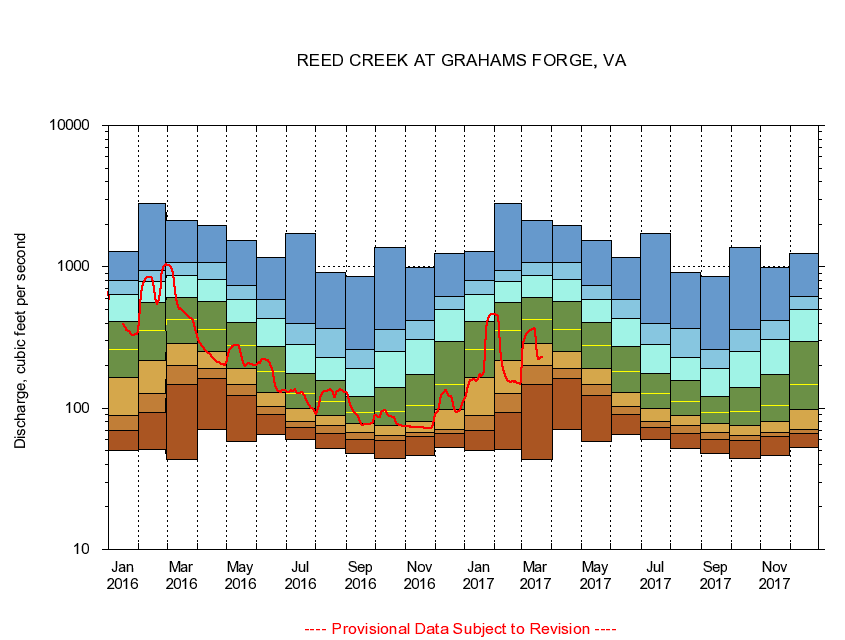
REED CREEK AT GRAHAMS FORGE, VA
|
Minimum daily flow
|
|
|
5th percentile
|
|
|
|
10th percentile
|
|
|
|
|
25th percentile
|
|
|
|
|
|
Median
|
|
|
|
|
|
|
75th percentile
|
|
|
|
|
|
|
|
90th percentile
|
|
|
|
|
|
|
|
|
95th percentile
|
|
|
|
|
|
|
|
|
|
Maximum daily flow
|
|
|
|
|
|
|
|
|
|
|
|
Years of record
|
January
|
49.9
|
69.3
|
88.5
|
165
|
262
|
408
|
634
|
804
|
1,290
|
|
96
|
February
|
50.6
|
92.9
|
128
|
217
|
353
|
563
|
788
|
938
|
2,820
|
|
96
|
March
|
43.6
|
147
|
200
|
287
|
425
|
603
|
862
|
1,080
|
2,140
|
|
96
|
April
|
70.6
|
163
|
190
|
250
|
362
|
571
|
814
|
1,070
|
1,960
|
|
96
|
May
|
57.9
|
123
|
147
|
192
|
278
|
402
|
591
|
740
|
1,540
|
|
97
|
June
|
64.9
|
89.9
|
102
|
130
|
182
|
274
|
433
|
588
|
1,170
|
|
97
|
July
|
59.6
|
73.4
|
80.3
|
98.7
|
126
|
177
|
284
|
400
|
1,730
|
|
97
|
August
|
51.9
|
66.6
|
75.1
|
88.7
|
112
|
156
|
229
|
365
|
916
|
|
97
|
September
|
47.7
|
60.2
|
67.5
|
77.6
|
93.6
|
121
|
190
|
260
|
852
|
|
97
|
October
|
44.4
|
58.6
|
63.9
|
75.7
|
94.1
|
139
|
250
|
360
|
1,360
|
|
95
|
November
|
46.0
|
63.5
|
67.2
|
79.9
|
105
|
172
|
308
|
414
|
985
|
|
96
|
December
|
52.3
|
66.4
|
70.9
|
97.2
|
148
|
296
|
501
|
619
|
1,250
|
|
96
|
|
|
|