|
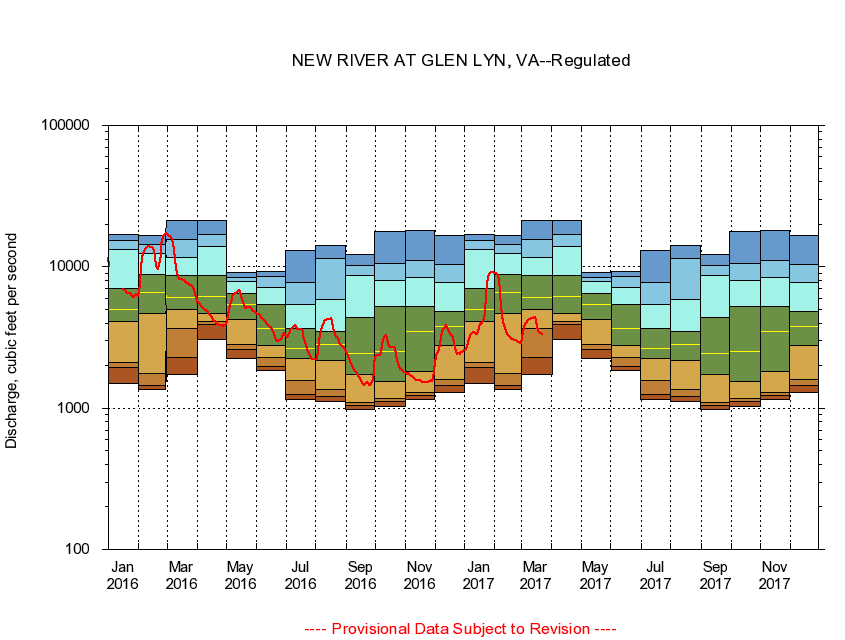
03176500
NEW RIVER AT GLEN LYN, VA
|
Minimum daily flow
|
|
|
5th percentile
|
|
|
|
10th percentile
|
|
|
|
|
25th percentile
|
|
|
|
|
|
Median
|
|
|
|
|
|
|
75th percentile
|
|
|
|
|
|
|
|
90th percentile
|
|
|
|
|
|
|
|
|
95th percentile
|
|
|
|
|
|
|
|
|
|
Maximum daily flow
|
|
|
|
|
|
|
|
|
|
|
|
Years of record
|
January
|
1,490
|
1,950
|
2,100
|
4,110
|
4,980
|
7,000
|
13,300
|
15,400
|
17,000
|
|
12
|
February
|
1,350
|
1,440
|
1,760
|
4,660
|
6,540
|
8,780
|
12,500
|
14,300
|
16,700
|
|
12
|
March
|
1,740
|
2,270
|
3,640
|
5,030
|
6,040
|
8,670
|
11,600
|
15,700
|
21,300
|
|
12
|
April
|
3,040
|
3,900
|
4,090
|
4,690
|
6,190
|
8,720
|
13,900
|
16,900
|
21,200
|
|
12
|
May
|
2,240
|
2,620
|
2,820
|
4,210
|
5,440
|
6,510
|
7,890
|
8,370
|
9,170
|
|
11
|
June
|
1,860
|
1,980
|
2,290
|
2,760
|
3,680
|
5,380
|
7,100
|
8,520
|
9,320
|
|
11
|
July
|
1,160
|
1,250
|
1,570
|
2,240
|
2,640
|
3,680
|
5,420
|
7,710
|
13,100
|
|
11
|
August
|
1,110
|
1,210
|
1,350
|
2,190
|
2,810
|
3,490
|
5,830
|
11,400
|
14,100
|
|
11
|
September
|
982
|
1,050
|
1,100
|
1,720
|
2,450
|
4,360
|
8,670
|
10,300
|
12,300
|
|
11
|
October
|
1,030
|
1,110
|
1,180
|
1,540
|
2,500
|
5,220
|
7,980
|
10,500
|
17,700
|
|
11
|
November
|
1,160
|
1,220
|
1,300
|
1,810
|
3,510
|
5,230
|
8,460
|
11,000
|
18,200
|
|
12
|
December
|
1,300
|
1,450
|
1,600
|
2,760
|
3,800
|
4,860
|
7,700
|
10,400
|
16,600
|
|
12
|
|
|
|