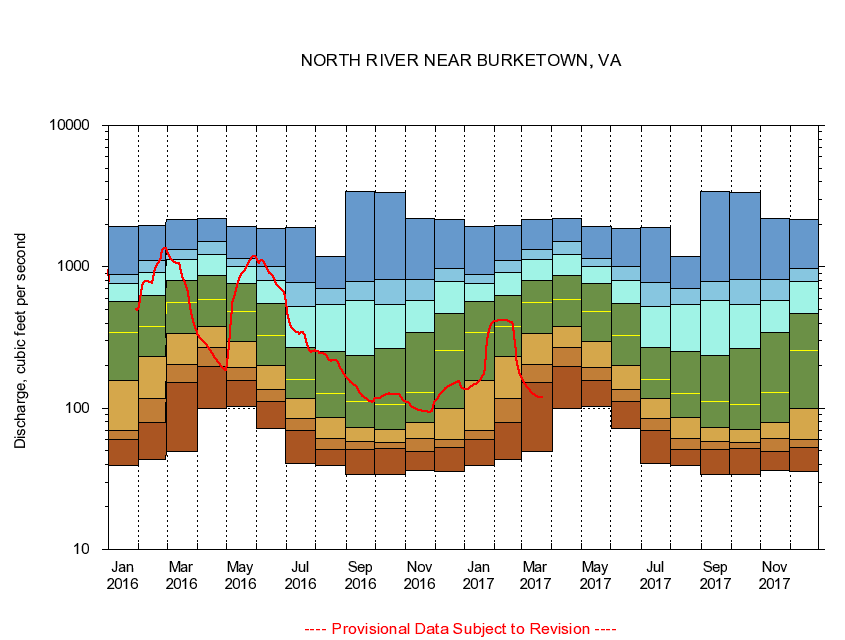
USGS - science for a changing world
Virginia DEQ

Virginia Water Science Center

 
  Duration Plot and Table of 28-Day Average Streamflow
 
01622000 NORTH RIVER NEAR BURKETOWN, VA
LOCATION.--Latitude 38°20'25", Longitude 78°54'50", North American Datum of 1927,
                    Rockingham County, VA, Hydrologic Unit 02070005.
DRAINAGE AREA.--375 square miles.
PERIOD OF RECORD.--October 1925 to October 1972, May 1975 to current year. Monthly discharge only for some periods, published in WSP 1302.
DURATION STATISTIC COMPUTATION PERIOD.--All data through September 2015.
REGULATION.--Diurnal fluctuation caused by discharge from wastewater treatment plant about 0.9 miles upstream and irrigation at points upstream. At a point 26.8 miles upstream, diversion of about 2.9 cubic feet per second.
GAGE OPERATION.--Virginia Department of Environmental Quality - Water Division.

     Duration Plot with 28-Day Average Streamflow Conditions
Provisional Data Subject to Revision
01622000 plot. 
NORTH RIVER NEAR BURKETOWN, VA
Provisional Data Subject to Revision


The current 28-day running-average value for 03/22/2017 is 119.32 cubic feet per second.

  explanation   Percentile Description Duration Plot Description 28 Day 14 Day 7 Day Daily


      Duration Table of 28-Day Average Streamflow
           
Flow values in cubic feet per second


                01622000     NORTH RIVER NEAR BURKETOWN, VA

   Minimum daily flow
   5th percentile
 
   10th percentile
 
   25th percentile
 
 
   Median
 
 
   75th percentile


   90th percentile


   95th percentile


   Maximum daily flow
         
Years of record
January
39.4
59.8
70.0
158
341
569
767
882
1,920
 
86
February
43.0
79.5
117
232
380
631
916
1,100
1,970
 
86
March
49.6
151
205
335
561
795
1,120
1,320
2,170
 
86
April
99.4
196
267
377
588
868
1,230
1,510
2,200
 
86
May
103
157
195
297
482
768
998
1,150
1,920
 
86
June
71.4
112
136
201
329
549
794
1,010
1,880
 
86
July
40.4
69.1
85.1
118
159
270
526
770
1,900
 
88
August
39.4
50.7
61.2
85.8
128
250
545
704
1,190
 
88
September
33.8
50.8
57.9
73.2
111
235
581
787
3,430
 
88
October
33.8
51.5
56.8
71.2
107
264
543
819
3,330
 
87
November
36.4
49.7
61.3
78.7
129
341
579
808
2,200
 
86
December
35.9
52.5
60.5
99.7
257
464
791
968
2,170
 
86


The current 28-day running-average value for 03/22/2017 is 119.32 cubic feet per second.

---- Provisional Data Subject to Revision ----

Accessibility FOIA Privacy Policies and Notices

Take Pride in America logo USA.gov logo U.S. Department of the Interior | U.S. Geological Survey
URL: http://va.water.usgs.gov/duration_plots/htm_28/dp01622000.htm
Page Contact Information: Virginia WSC Webmaster
Page Last Modified: 6/19/2016