|
01628500
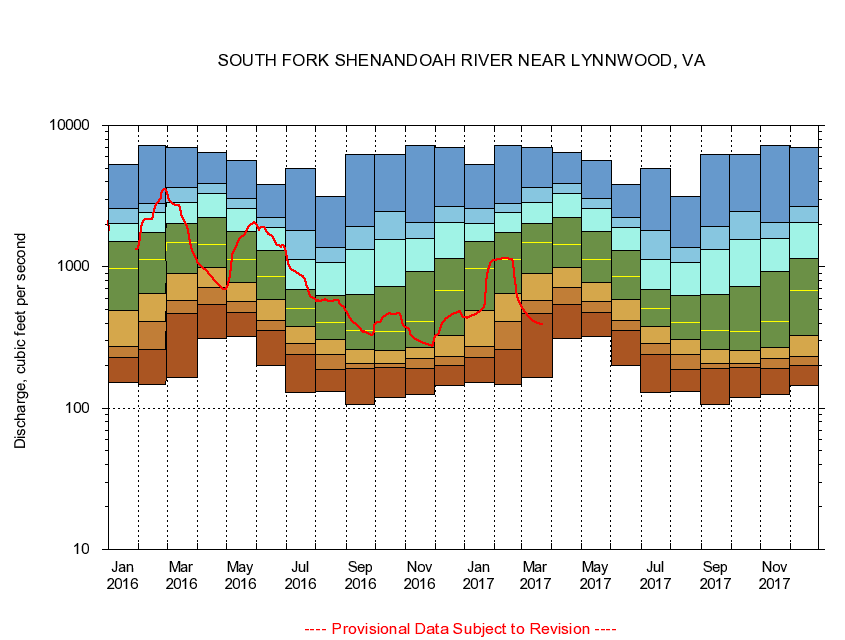
SOUTH FORK SHENANDOAH RIVER NEAR LYNNWOOD, VA
|
Minimum daily flow
|
|
|
5th percentile
|
|
|
|
10th percentile
|
|
|
|
|
25th percentile
|
|
|
|
|
|
Median
|
|
|
|
|
|
|
75th percentile
|
|
|
|
|
|
|
|
90th percentile
|
|
|
|
|
|
|
|
|
95th percentile
|
|
|
|
|
|
|
|
|
|
Maximum daily flow
|
|
|
|
|
|
|
|
|
|
|
|
Years of record
|
January
|
152
|
228
|
271
|
492
|
977
|
1,520
|
2,010
|
2,570
|
5,310
|
|
85
|
February
|
146
|
262
|
409
|
643
|
1,130
|
1,750
|
2,430
|
2,810
|
7,260
|
|
85
|
March
|
166
|
471
|
577
|
895
|
1,480
|
2,010
|
2,870
|
3,650
|
7,010
|
|
85
|
April
|
310
|
542
|
714
|
986
|
1,440
|
2,220
|
3,290
|
3,890
|
6,450
|
|
85
|
May
|
320
|
479
|
565
|
777
|
1,120
|
1,770
|
2,570
|
3,020
|
5,640
|
|
85
|
June
|
201
|
357
|
416
|
592
|
859
|
1,310
|
1,890
|
2,220
|
3,840
|
|
85
|
July
|
129
|
239
|
286
|
377
|
511
|
693
|
1,120
|
1,810
|
4,970
|
|
85
|
August
|
131
|
189
|
238
|
305
|
401
|
624
|
1,080
|
1,370
|
3,140
|
|
85
|
September
|
106
|
191
|
208
|
260
|
352
|
636
|
1,320
|
1,930
|
6,190
|
|
85
|
October
|
119
|
193
|
206
|
254
|
348
|
726
|
1,560
|
2,480
|
6,220
|
|
84
|
November
|
124
|
192
|
224
|
270
|
409
|
928
|
1,580
|
2,050
|
7,250
|
|
85
|
December
|
144
|
199
|
232
|
325
|
675
|
1,150
|
2,070
|
2,680
|
7,040
|
|
85
|
|
|
|