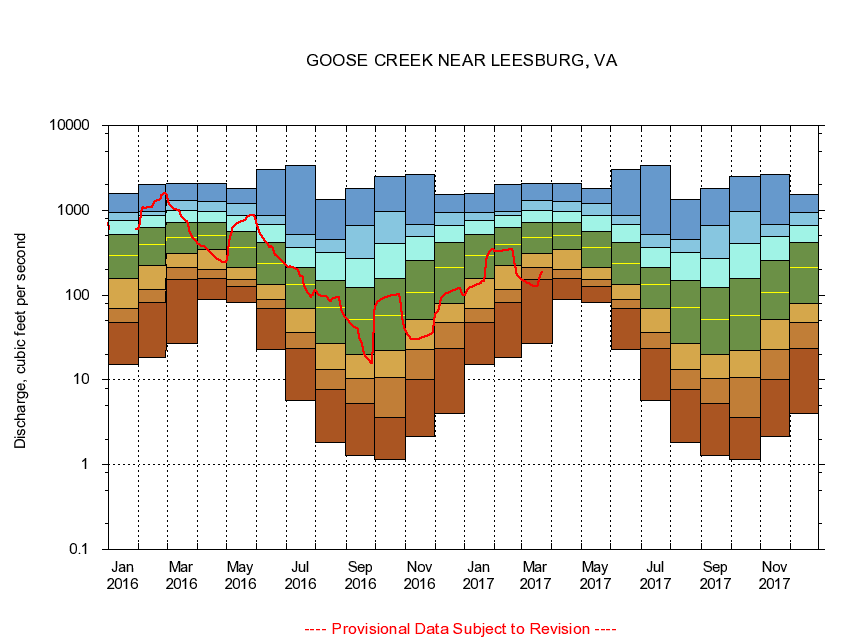
USGS - science for a changing world
Virginia DEQ

Virginia Water Science Center

 
  Duration Plot and Table of 28-Day Average Streamflow
 
01644000 GOOSE CREEK NEAR LEESBURG, VA
LOCATION.--Latitude 39°01'10", Longitude 77°34'40", North American Datum of 1927,
                    Loudoun County, VA, Hydrologic Unit 02070008.
DRAINAGE AREA.--332 square miles.
PERIOD OF RECORD.--July 1909 to April 1911, September 1911 to December 1912, January 1930 to current year.
DURATION STATISTIC COMPUTATION PERIOD.--All data through September 2015.
REGULATION.--No known regulation.
GAGE OPERATION.--Virginia Department of Environmental Quality - Water Division.

     Duration Plot with 28-Day Average Streamflow Conditions
Provisional Data Subject to Revision
01644000 plot. 
GOOSE CREEK NEAR LEESBURG, VA
Provisional Data Subject to Revision


The current 28-day running-average value for 03/22/2017 is 186.21 cubic feet per second.

  explanation   Percentile Description Duration Plot Description 28 Day 14 Day 7 Day Daily


      Duration Table of 28-Day Average Streamflow
           
Flow values in cubic feet per second


                01644000     GOOSE CREEK NEAR LEESBURG, VA

   Minimum daily flow
   5th percentile
 
   10th percentile
 
   25th percentile
 
 
   Median
 
 
   75th percentile


   90th percentile


   95th percentile


   Maximum daily flow
         
Years of record
January
15.3
47.8
70.3
155
297
522
763
935
1,590
 
88
February
18.6
82.0
115
222
390
623
870
978
1,990
 
89
March
26.6
154
209
307
477
727
990
1,310
2,050
 
89
April
88.3
158
198
345
498
714
966
1,280
2,070
 
89
May
82.4
128
154
213
360
569
875
1,210
1,820
 
88
June
23.0
69.6
89.0
135
234
416
680
877
3,050
 
88
July
5.65
23.7
36.0
69.2
135
212
366
516
3,410
 
88
August
1.84
7.78
13.1
27.1
72.2
149
317
456
1,340
 
88
September
1.28
5.29
10.5
20.2
51.6
122
273
663
1,820
 
89
October
1.14
3.60
10.6
22.0
57.9
158
405
959
2,490
 
89
November
2.17
10.0
23.0
51.4
107
258
493
678
2,640
 
89
December
4.00
23.2
48.0
80.1
211
416
655
952
1,540
 
89


The current 28-day running-average value for 03/22/2017 is 186.21 cubic feet per second.

---- Provisional Data Subject to Revision ----

Accessibility FOIA Privacy Policies and Notices

Take Pride in America logo USA.gov logo U.S. Department of the Interior | U.S. Geological Survey
URL: http://va.water.usgs.gov/duration_plots/htm_28/dp01644000.htm
Page Contact Information: Virginia WSC Webmaster
Page Last Modified: 6/19/2016