USGS - science for a changing world
Virginia DEQ

Virginia Water Science Center

 
  Duration Plot and Table of 28-Day Average Streamflow
 
02030000 HARDWARE RIVER BELOW BRIERY CREEK, NEAR SCOTTSVILLE, VA
LOCATION.--Latitude 37°48'45", Longitude 78°27'20", North American Datum of 1927,
                    Fluvanna County, VA, Hydrologic Unit 02080203.
DRAINAGE AREA.--116 square miles.
PERIOD OF RECORD.--October 1938 to September 1995, October 1996 to current year. Monthly discharge only for some periods, published in WSP 1303. Published as "below Briery Run" prior to October 1990.
DURATION STATISTIC COMPUTATION PERIOD.--All data through September 2015.
REGULATION.--No known regulation.
GAGE OPERATION.--Virginia Department of Environmental Quality - Water Division.

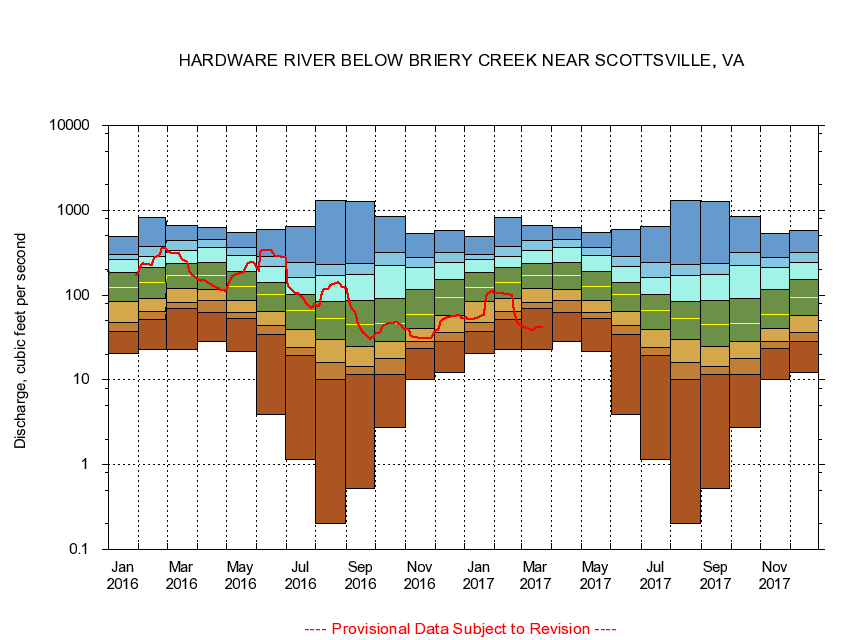
     Duration Plot with 28-Day Average Streamflow Conditions
Provisional Data Subject to Revision
02030000 plot. 
HARDWARE RIVER BELOW BRIERY CREEK NEAR SCOTTSVILLE, VA
Provisional Data Subject to Revision


The current 28-day running-average value for 03/22/2017 is 41.86 cubic feet per second.

  explanation   Percentile Description Duration Plot Description 28 Day 14 Day 7 Day Daily


      Duration Table of 28-Day Average Streamflow
           
Flow values in cubic feet per second


                02030000     HARDWARE RIVER BELOW BRIERY CREEK NEAR SCOTTSVILLE, VA

   Minimum daily flow
   5th percentile
 
   10th percentile
 
   25th percentile
 
 
   Median
 
 
   75th percentile


   90th percentile


   95th percentile


   Maximum daily flow
         
Years of record
January
20.6
37.2
47.2
84.0
124
185
263
305
486
 
76
February
23.1
51.8
63.3
91.0
140
209
288
371
828
 
76
March
23.1
68.8
82.9
121
170
235
340
440
666
 
76
April
28.4
62.2
86.9
116
168
243
360
453
631
 
76
May
21.4
53.0
62.2
86.7
126
190
292
366
554
 
76
June
3.92
34.0
43.8
64.9
102
142
220
289
590
 
76
July
1.16
19.3
24.1
39.3
66.6
103
162
241
642
 
76
August
0.20
10.2
16.0
30.2
53.0
84.4
170
230
1,300
 
76
September
0.53
11.5
14.4
24.5
45.5
87.2
174
239
1,260
 
76
October
2.76
11.7
17.9
28.0
46.3
92.0
225
317
836
 
74
November
10.0
23.6
28.5
40.8
59.2
115
209
278
531
 
76
December
12.1
28.5
36.1
57.9
94.4
153
244
316
585
 
76


The current 28-day running-average value for 03/22/2017 is 41.86 cubic feet per second.

---- Provisional Data Subject to Revision ----

Accessibility FOIA Privacy Policies and Notices

Take Pride in America logo USA.gov logo U.S. Department of the Interior | U.S. Geological Survey
URL: http://va.water.usgs.gov/duration_plots/htm_28/dp02030000.htm
Page Contact Information: Virginia WSC Webmaster
Page Last Modified: 6/19/2016