|
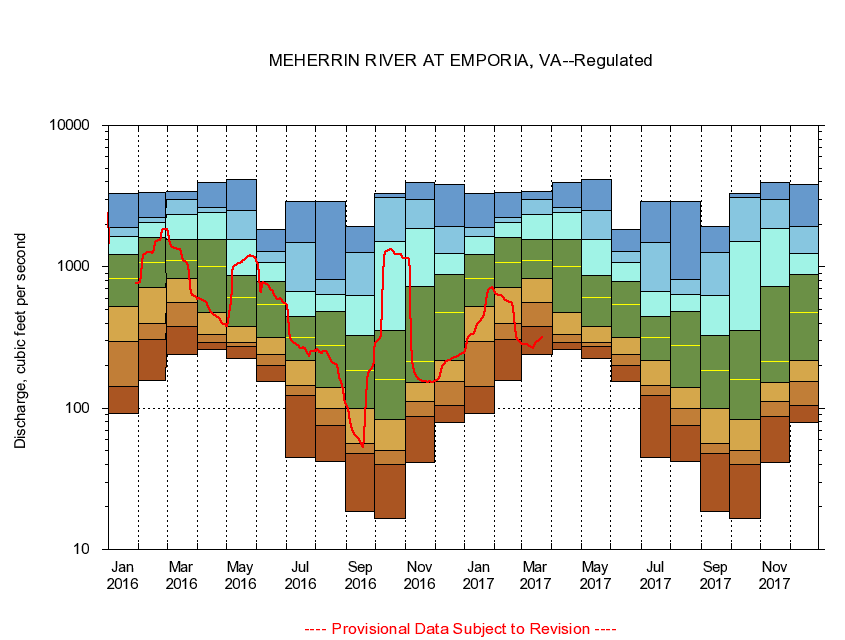
02052000
MEHERRIN RIVER AT EMPORIA, VA
|
Minimum daily flow
|
|
|
5th percentile
|
|
|
|
10th percentile
|
|
|
|
|
25th percentile
|
|
|
|
|
|
Median
|
|
|
|
|
|
|
75th percentile
|
|
|
|
|
|
|
|
90th percentile
|
|
|
|
|
|
|
|
|
95th percentile
|
|
|
|
|
|
|
|
|
|
Maximum daily flow
|
|
|
|
|
|
|
|
|
|
|
|
Years of record
|
January
|
91.4
|
142
|
297
|
523
|
825
|
1,230
|
1,640
|
1,900
|
3,310
|
|
21
|
February
|
156
|
306
|
399
|
710
|
1,070
|
1,610
|
2,070
|
2,220
|
3,360
|
|
21
|
March
|
240
|
381
|
561
|
825
|
1,100
|
1,560
|
2,330
|
3,000
|
3,400
|
|
21
|
April
|
258
|
292
|
334
|
479
|
998
|
1,550
|
2,420
|
2,620
|
3,930
|
|
20
|
May
|
225
|
271
|
291
|
380
|
611
|
867
|
1,550
|
2,490
|
4,120
|
|
20
|
June
|
155
|
202
|
240
|
316
|
540
|
792
|
1,070
|
1,280
|
1,840
|
|
20
|
July
|
45.0
|
122
|
144
|
219
|
314
|
443
|
667
|
1,490
|
2,910
|
|
20
|
August
|
41.8
|
75.8
|
99.2
|
140
|
277
|
481
|
638
|
812
|
2,920
|
|
20
|
September
|
18.5
|
47.5
|
56.0
|
100
|
186
|
326
|
623
|
1,270
|
1,930
|
|
20
|
October
|
16.6
|
40.1
|
50.1
|
83.1
|
160
|
357
|
1,500
|
3,090
|
3,310
|
|
20
|
November
|
41.0
|
86.9
|
112
|
151
|
215
|
723
|
1,870
|
2,990
|
3,920
|
|
20
|
December
|
79.3
|
104
|
154
|
219
|
472
|
884
|
1,250
|
1,930
|
3,830
|
|
21
|
|
|
|