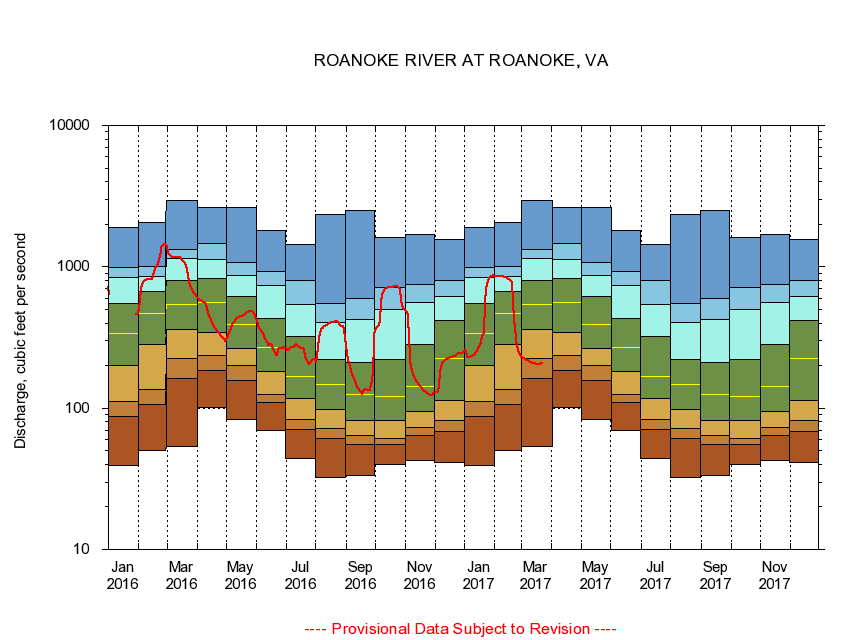
USGS - science for a changing world
Virginia DEQ

Virginia Water Science Center

 
  Duration Plot and Table of 28-Day Average Streamflow
 
02055000 ROANOKE RIVER AT ROANOKE, VA
LOCATION.--Latitude 37°15'30", Longitude 79°56'20", North American Datum of 1927,
                    Roanoke City, VA, Hydrologic Unit 03010101.
DRAINAGE AREA.--384 square miles.
PERIOD OF RECORD.--February 1899 to current year. Monthly discharge only for some periods, published in WSP 1303. Records for July 1896 to January 1899 published in WSP 11, 15, 27, and 20th Annual Report, Part 4, are unreliable, due to doubtful gage-height record, and should not be used.
DURATION STATISTIC COMPUTATION PERIOD.--All data through September 2015.
REGULATION.--Prior to 1949, diurnal fluctuation caused by powerplants. After 1994, withdrawal of 11.1 cfs.
GAGE OPERATION.--U.S. Geological Survey, Virginia Water Science Center.

     Duration Plot with 28-Day Average Streamflow Conditions
Provisional Data Subject to Revision
02055000 plot. 
ROANOKE RIVER AT ROANOKE, VA
Provisional Data Subject to Revision


The current 28-day running-average value for 03/22/2017 is 206.07 cubic feet per second.

  explanation   Percentile Description Duration Plot Description 28 Day 14 Day 7 Day Daily


      Duration Table of 28-Day Average Streamflow
           
Flow values in cubic feet per second


                02055000     ROANOKE RIVER AT ROANOKE, VA

   Minimum daily flow
   5th percentile
 
   10th percentile
 
   25th percentile
 
 
   Median
 
 
   75th percentile


   90th percentile


   95th percentile


   Maximum daily flow
         
Years of record
January
39.6
87.3
111
202
340
547
842
989
1,890
 
115
February
49.9
107
135
281
464
665
852
1,010
2,070
 
116
March
53.5
163
226
359
542
795
1,140
1,320
2,960
 
116
April
101
184
234
343
558
822
1,130
1,470
2,650
 
117
May
83.5
157
199
264
394
616
865
1,070
2,650
 
117
June
70.0
109
125
182
269
432
737
930
1,820
 
117
July
44.2
71.1
83.7
118
168
319
543
803
1,430
 
117
August
32.1
61.4
71.6
97.6
147
221
405
546
2,350
 
117
September
33.2
55.0
63.8
82.0
124
211
424
593
2,490
 
117
October
39.9
55.4
61.1
82.2
121
220
495
714
1,620
 
115
November
42.4
64.2
72.5
94.1
143
283
559
749
1,680
 
115
December
41.1
68.6
82.1
114
224
417
621
805
1,550
 
115


The current 28-day running-average value for 03/22/2017 is 206.07 cubic feet per second.

---- Provisional Data Subject to Revision ----

Accessibility FOIA Privacy Policies and Notices

Take Pride in America logo USA.gov logo U.S. Department of the Interior | U.S. Geological Survey
URL: http://va.water.usgs.gov/duration_plots/htm_28/dp02055000.htm
Page Contact Information: Virginia WSC Webmaster
Page Last Modified: 6/19/2016