|
03170000
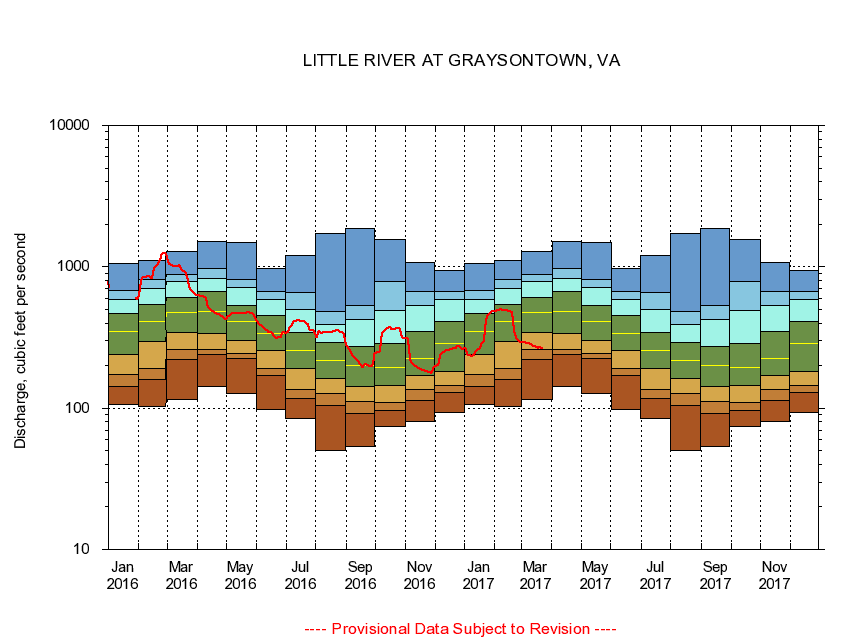
LITTLE RIVER AT GRAYSONTOWN, VA
|
Minimum daily flow
|
|
|
5th percentile
|
|
|
|
10th percentile
|
|
|
|
|
25th percentile
|
|
|
|
|
|
Median
|
|
|
|
|
|
|
75th percentile
|
|
|
|
|
|
|
|
90th percentile
|
|
|
|
|
|
|
|
|
95th percentile
|
|
|
|
|
|
|
|
|
|
Maximum daily flow
|
|
|
|
|
|
|
|
|
|
|
|
Years of record
|
January
|
107
|
142
|
172
|
241
|
348
|
465
|
590
|
681
|
1,060
|
|
87
|
February
|
102
|
159
|
192
|
296
|
412
|
543
|
700
|
808
|
1,100
|
|
87
|
March
|
116
|
221
|
258
|
345
|
475
|
610
|
783
|
882
|
1,290
|
|
87
|
April
|
142
|
240
|
261
|
338
|
483
|
673
|
825
|
970
|
1,500
|
|
87
|
May
|
127
|
223
|
244
|
300
|
412
|
533
|
712
|
811
|
1,490
|
|
87
|
June
|
98.0
|
169
|
191
|
254
|
339
|
455
|
588
|
674
|
981
|
|
87
|
July
|
84.3
|
117
|
136
|
190
|
255
|
344
|
495
|
656
|
1,200
|
|
87
|
August
|
50.5
|
104
|
128
|
162
|
217
|
291
|
394
|
486
|
1,730
|
|
87
|
September
|
53.9
|
92.3
|
111
|
142
|
202
|
271
|
424
|
533
|
1,880
|
|
87
|
October
|
73.8
|
95.7
|
110
|
145
|
194
|
288
|
494
|
787
|
1,550
|
|
86
|
November
|
80.2
|
113
|
136
|
169
|
226
|
348
|
533
|
671
|
1,070
|
|
87
|
December
|
93.6
|
130
|
144
|
183
|
288
|
412
|
583
|
667
|
948
|
|
87
|
|
|
|