USGS - science for a changing world
Virginia DEQ

Virginia Water Science Center

 
  Duration Plot and Table of 7-Day Average Streamflow
 
01616500 OPEQUON CREEK NEAR MARTINSBURG, WV
LOCATION.--Latitude 39°25'25", Longitude 77°56'20", North American Datum of 1927
                    Berkeley County, W. Va., Hydrologic Unit 02070004.
DRAINAGE AREA.--273 square miles.
PERIOD OF RECORD.--May 1905 to July 1906, July 1947 to current year.
DURATION STATISTIC COMPUTATION PERIOD.--All data through September 2015.
REGULATION.--Some diurnal fluctuation at low flow caused by upstream mills in Virginia and since July 18, 1988, by wastewater treatment plant, downstream from Opequon Creek near Berryville, Va (01615000); drainage area 58.2 mi2.
GAGE OPERATION.--U.S. Geological Survey, West Virginia Water Science Center.

     Duration Plot with 7-Day Average Streamflow Conditions
Provisional Data Subject to Revision
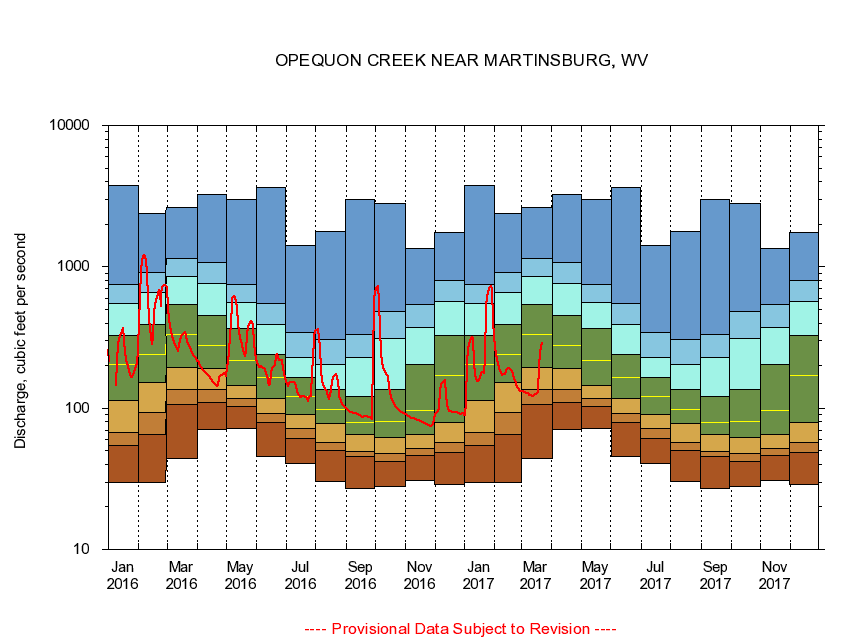
01616500 plot. 
OPEQUON CREEK NEAR MARTINSBURG, WV
Provisional Data Subject to Revision


The current 7-day running-average value for 03/22/2017 is 287.43 cubic feet per second.

  explanation   Percentile Description Duration Plot Description 28 Day 14 Day 7 Day Daily


      Duration Table of 7-Day Average Streamflow
           
Flow values in cubic feet per second


                01616500     OPEQUON CREEK NEAR MARTINSBURG, WV

   Minimum daily flow
   5th percentile
 
   10th percentile
 
   25th percentile
 
 
   Median
 
 
   75th percentile


   90th percentile


   95th percentile


   Maximum daily flow
         
Years of record
January
30.0
54.1
67.6
113
204
329
554
745
3,780
 
68
February
30.0
64.7
93.7
151
240
391
659
911
2,380
 
68
March
43.9
107
135
193
332
543
858
1,150
2,640
 
68
April
70.9
109
136
192
276
456
760
1,080
3,230
 
68
May
71.3
102
117
144
218
366
558
752
2,990
 
68
June
45.7
78.7
91.3
117
166
241
391
553
3,630
 
68
July
40.3
61.4
71.9
90.9
121
164
230
343
1,410
 
68
August
30.3
50.3
57.3
77.3
97.7
135
204
306
1,770
 
69
September
27.0
45.3
49.7
65.0
79.6
121
228
331
3,000
 
69
October
28.1
41.7
47.6
61.6
81.0
136
311
481
2,810
 
68
November
30.9
46.3
51.7
65.6
96.4
204
371
545
1,340
 
68
December
29.0
48.8
57.1
79.4
169
325
572
794
1,760
 
68


The current 7-day running-average value for 03/22/2017 is 287.43 cubic feet per second.

---- Provisional Data Subject to Revision ----

Accessibility FOIA Privacy Policies and Notices

Take Pride in America logo USA.gov logo U.S. Department of the Interior | U.S. Geological Survey
URL: http://va.water.usgs.gov/duration_plots/htm_7/dp01616500.htm
Page Contact Information: Virginia WSC Webmaster
Page Last Modified: 6/19/2016