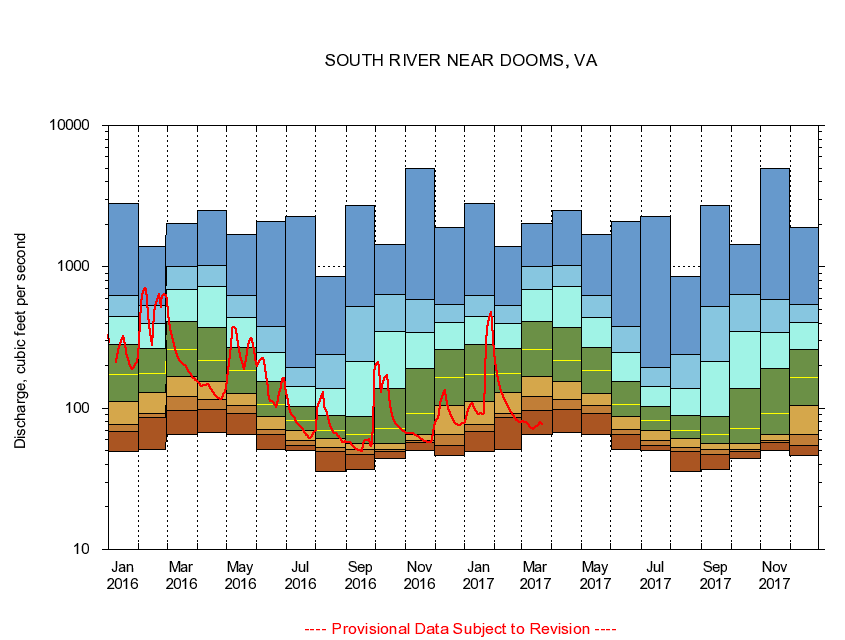
USGS - science for a changing world
Virginia DEQ

Virginia Water Science Center

 
  Duration Plot and Table of 7-Day Average Streamflow
 
01626850 SOUTH RIVER NEAR DOOMS, VA
LOCATION.--Latitude 38°05'19", Longitude 78°52'38", North American Datum of 1927,
                    Waynesboro City, VA, Hydrologic Unit 02070005.
DRAINAGE AREA.--148 square miles.
PERIOD OF RECORD.--April 1974 to September 1996, 2005 to current year.
DURATION STATISTIC COMPUTATION PERIOD.--All data through September 2007.
REGULATION.--Discharge for industrial plant, 2.6 mile upstream, originating from well fields, adds about 6.0 cfs. Wastwater treatment upstream estimated input 12.6 cfs.
GAGE OPERATION.--Virginia Department of Environmental Quality - Water Division.

     Duration Plot with 7-Day Average Streamflow Conditions
Provisional Data Subject to Revision
01626850 plot. 
SOUTH RIVER NEAR DOOMS, VA
Provisional Data Subject to Revision


The current 7-day running-average value for 08/27/2008 is 38.29 cubic feet per second.

  explanation   Percentile Description Duration Plot Description 28 Day 14 Day 7 Day Daily


      Duration Table of 7-Day Average Streamflow
           
Flow values in cubic feet per second


                01626850     SOUTH RIVER NEAR DOOMS, VA

   Minimum daily flow
   5th percentile
 
   10th percentile
 
   25th percentile
 
 
   Median
 
 
   75th percentile


   90th percentile


   95th percentile


   Maximum daily flow
         
Years of record
January
49.0
69.9
89.4
122
182
299
512
661
2,800
 
24
February
50.9
88.9
105
146
185
272
399
534
1,390
 
24
March
65.3
100
126
166
257
430
741
1,120
2,030
 
24
April
67.7
94.4
107
142
213
406
843
1,040
2,490
 
24
May
65.0
85.7
101
124
174
247
425
602
1,700
 
25
June
50.7
64.9
70.4
89.7
113
159
264
387
2,080
 
25
July
50.0
58.7
64.1
72.7
85.3
106
146
229
2,270
 
25
August
45.6
52.5
56.9
63.9
72.6
93.4
178
286
859
 
26
September
45.7
52.0
54.1
58.9
68.0
97.9
276
600
2,730
 
26
October
48.9
51.1
53.9
58.6
73.0
198
433
664
1,450
 
25
November
49.9
58.9
60.6
68.8
106
215
382
623
4,960
 
25
December
51.3
59.4
67.7
113
165
250
377
477
1,900
 
24


The current 7-day running-average value for 08/27/2008 is 38.29 cubic feet per second.

---- Provisional Data Subject to Revision ----

Accessibility FOIA Privacy Policies and Notices

Take Pride in America logo USA.gov logo U.S. Department of the Interior | U.S. Geological Survey
URL: http://va.water.usgs.gov/duration_plots/htm_7/dp01626850.htm
Page Contact Information: Virginia WSC Webmaster
Page Last Modified: 8/6/2008