|
01627500
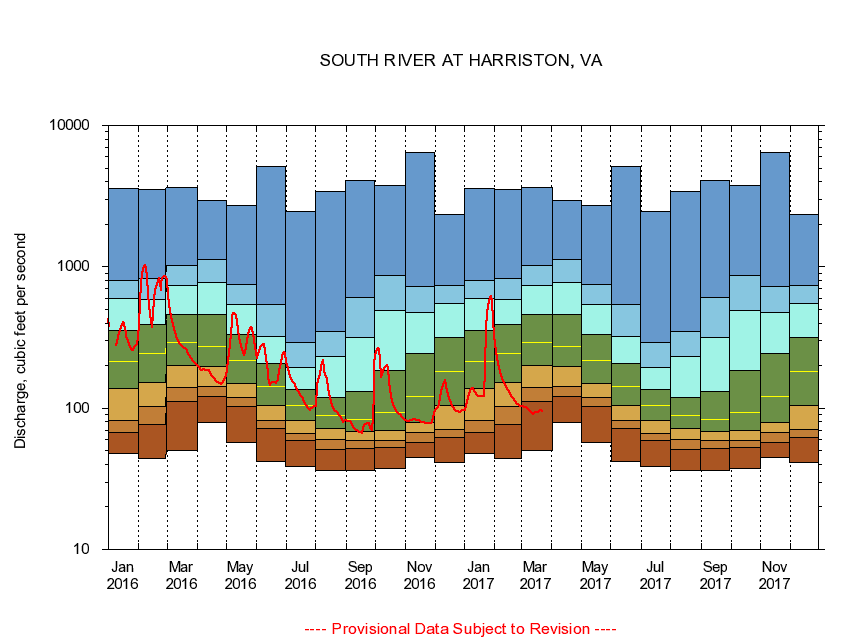
SOUTH RIVER AT HARRISTON, VA
|
Minimum daily flow
|
|
|
5th percentile
|
|
|
|
10th percentile
|
|
|
|
|
25th percentile
|
|
|
|
|
|
Median
|
|
|
|
|
|
|
75th percentile
|
|
|
|
|
|
|
|
90th percentile
|
|
|
|
|
|
|
|
|
95th percentile
|
|
|
|
|
|
|
|
|
|
Maximum daily flow
|
|
|
|
|
|
|
|
|
|
|
|
Years of record
|
January
|
47.7
|
67.6
|
82.0
|
137
|
213
|
353
|
598
|
806
|
3,560
|
|
73
|
February
|
44.0
|
76.4
|
103
|
152
|
243
|
389
|
589
|
830
|
3,550
|
|
73
|
March
|
50.3
|
112
|
141
|
199
|
293
|
462
|
739
|
1,030
|
3,640
|
|
74
|
April
|
79.4
|
121
|
143
|
196
|
274
|
460
|
777
|
1,120
|
2,970
|
|
74
|
May
|
57.3
|
102
|
119
|
150
|
218
|
333
|
538
|
755
|
2,720
|
|
74
|
June
|
42.1
|
71.4
|
81.9
|
104
|
142
|
208
|
323
|
541
|
5,090
|
|
74
|
July
|
38.6
|
58.9
|
66.4
|
82.4
|
105
|
136
|
193
|
290
|
2,450
|
|
74
|
August
|
36.1
|
51.1
|
59.9
|
72.3
|
89.4
|
119
|
232
|
349
|
3,400
|
|
74
|
September
|
36.3
|
51.6
|
58.6
|
68.1
|
83.1
|
132
|
315
|
605
|
4,050
|
|
74
|
October
|
37.7
|
52.4
|
58.9
|
69.0
|
92.7
|
184
|
490
|
862
|
3,790
|
|
72
|
November
|
44.6
|
57.5
|
67.3
|
79.3
|
120
|
244
|
474
|
720
|
6,460
|
|
73
|
December
|
41.3
|
62.0
|
70.8
|
105
|
182
|
317
|
546
|
734
|
2,350
|
|
73
|
|
|
|