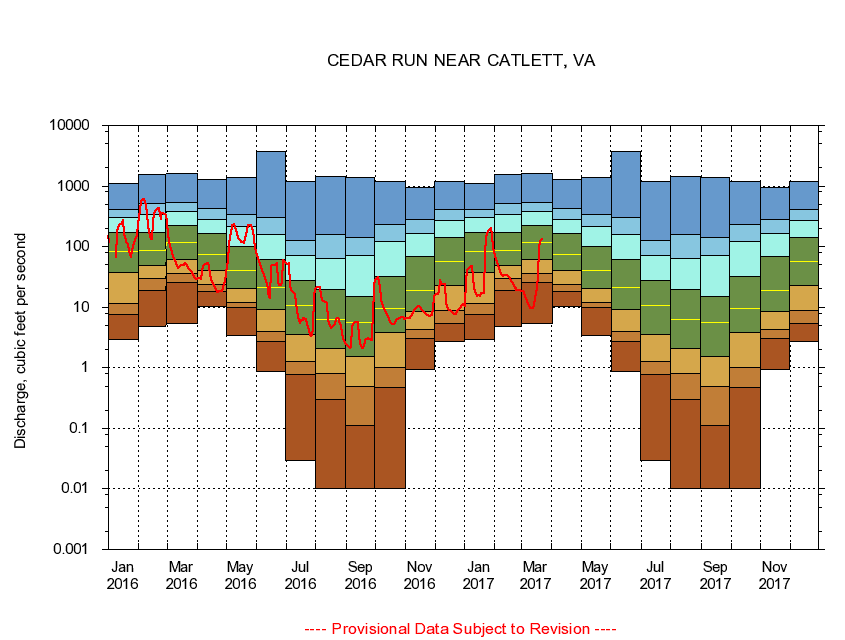
USGS - science for a changing world
Virginia DEQ

Virginia Water Science Center

 
  Duration Plot and Table of 7-Day Average Streamflow
 
01656000 CEDAR RUN NEAR CATLETT, VA
LOCATION.--Latitude 38°38'12", Longitude 77°37'31", North American Datum of 1927,
                    Fauquier County, VA, Hydrologic Unit 02070010.
DRAINAGE AREA.--93.4 square miles.
PERIOD OF RECORD.--July 1950 to December 1986, January 1986 to September 1989 (annual maximum only), October 1989 to current year.
DURATION STATISTIC COMPUTATION PERIOD.--All data through September 2015.
REGULATION.--No known regulation.
GAGE OPERATION.--Virginia Department of Environmental Quality - Water Division.

     Duration Plot with 7-Day Average Streamflow Conditions
Provisional Data Subject to Revision
01656000 plot. 
CEDAR RUN NEAR CATLETT, VA
Provisional Data Subject to Revision


The current 7-day running-average value for 03/22/2017 is 133.14 cubic feet per second.

  explanation   Percentile Description Duration Plot Description 28 Day 14 Day 7 Day Daily


      Duration Table of 7-Day Average Streamflow
           
Flow values in cubic feet per second


                01656000     CEDAR RUN NEAR CATLETT, VA

   Minimum daily flow
   5th percentile
 
   10th percentile
 
   25th percentile
 
 
   Median
 
 
   75th percentile


   90th percentile


   95th percentile


   Maximum daily flow
         
Years of record
January
2.94
7.71
11.3
36.8
81.6
173
302
409
1,090
 
62
February
4.87
18.9
29.7
48.7
87.4
173
337
519
1,540
 
62
March
5.36
25.9
36.0
60.7
117
221
382
531
1,600
 
62
April
10.3
18.3
23.4
41.0
73.8
162
280
420
1,290
 
62
May
3.44
9.83
12.1
20.7
40.8
101
214
340
1,390
 
62
June
0.87
2.70
3.96
9.29
21.4
60.2
160
301
3,750
 
62
July
0.03
0.77
1.27
3.48
10.5
27.3
71.3
125
1,200
 
62
August
0.00
0.30
0.80
2.08
6.38
19.7
63.8
159
1,420
 
62
September
0.00
0.11
0.50
1.55
5.50
15.3
72.3
140
1,400
 
62
October
0.00
0.47
1.01
3.86
9.46
31.8
121
236
1,210
 
62
November
0.92
3.04
4.22
8.46
19.1
68.4
167
276
943
 
63
December
2.74
5.39
8.87
22.9
56.4
144
275
410
1,180
 
63


The current 7-day running-average value for 03/22/2017 is 133.14 cubic feet per second.

---- Provisional Data Subject to Revision ----

Accessibility FOIA Privacy Policies and Notices

Take Pride in America logo USA.gov logo U.S. Department of the Interior | U.S. Geological Survey
URL: http://va.water.usgs.gov/duration_plots/htm_7/dp01656000.htm
Page Contact Information: Virginia WSC Webmaster
Page Last Modified: 6/19/2016