|
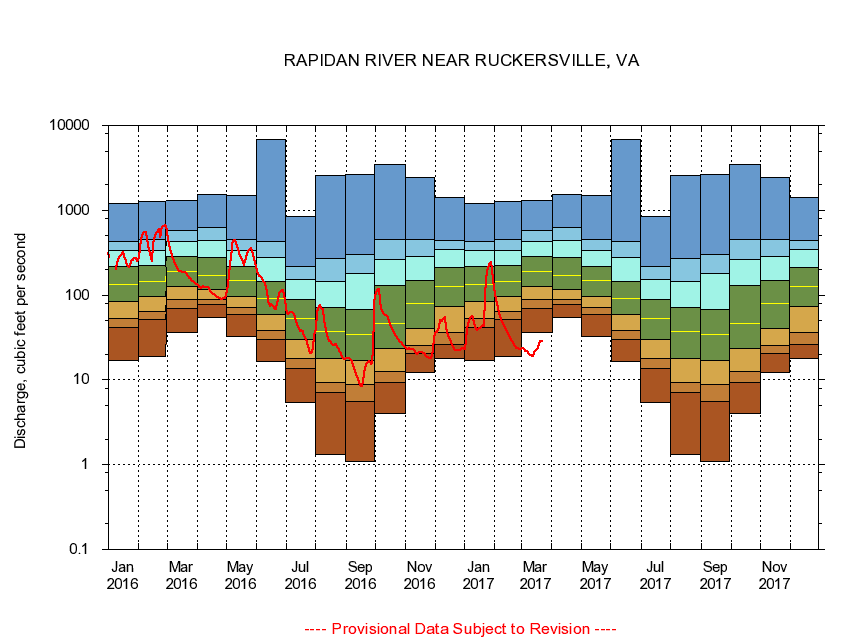
01665500
RAPIDAN RIVER NEAR RUCKERSVILLE, VA
|
Minimum daily flow
|
|
|
5th percentile
|
|
|
|
10th percentile
|
|
|
|
|
25th percentile
|
|
|
|
|
|
Median
|
|
|
|
|
|
|
75th percentile
|
|
|
|
|
|
|
|
90th percentile
|
|
|
|
|
|
|
|
|
95th percentile
|
|
|
|
|
|
|
|
|
|
Maximum daily flow
|
|
|
|
|
|
|
|
|
|
|
|
Years of record
|
January
|
17.0
|
41.6
|
53.4
|
84.6
|
133
|
215
|
337
|
423
|
1,210
|
|
70
|
February
|
19.1
|
52.0
|
63.6
|
96.4
|
144
|
221
|
339
|
451
|
1,270
|
|
70
|
March
|
36.1
|
70.3
|
88.7
|
125
|
190
|
286
|
430
|
572
|
1,320
|
|
70
|
April
|
54.1
|
77.2
|
88.0
|
117
|
171
|
274
|
441
|
635
|
1,530
|
|
70
|
May
|
32.9
|
59.7
|
70.7
|
96.1
|
150
|
220
|
340
|
450
|
1,490
|
|
70
|
June
|
16.3
|
30.1
|
38.2
|
59.0
|
90.1
|
145
|
279
|
424
|
6,920
|
|
70
|
July
|
5.40
|
13.8
|
18.0
|
30.1
|
53.1
|
89.3
|
154
|
219
|
837
|
|
69
|
August
|
1.33
|
7.09
|
9.33
|
17.9
|
37.6
|
71.6
|
143
|
272
|
2,570
|
|
69
|
September
|
1.08
|
5.62
|
8.72
|
17.0
|
34.0
|
68.5
|
182
|
302
|
2,630
|
|
69
|
October
|
4.06
|
9.43
|
12.7
|
23.3
|
46.4
|
130
|
266
|
454
|
3,500
|
|
69
|
November
|
12.3
|
20.3
|
25.3
|
40.2
|
79.3
|
150
|
287
|
447
|
2,450
|
|
70
|
December
|
18.1
|
26.3
|
36.4
|
72.7
|
126
|
213
|
344
|
445
|
1,420
|
|
70
|
|
|
|