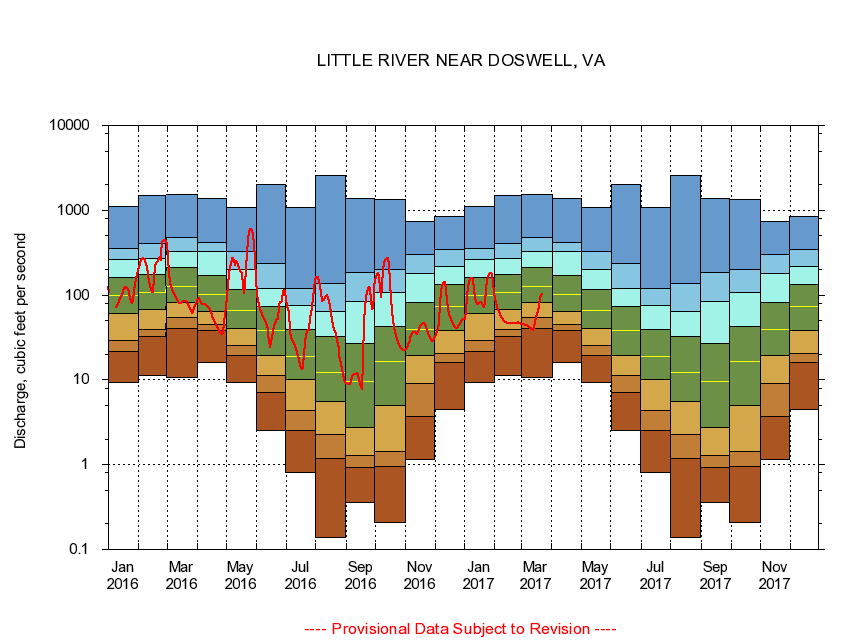
USGS - science for a changing world
Virginia DEQ

Virginia Water Science Center

 
  Duration Plot and Table of 7-Day Average Streamflow
 
01671100 LITTLE RIVER NEAR DOSWELL, VA
LOCATION.--Latitude 37°52'21", Longitude 77°30'48", North American Datum of 1927,
                    Hanover County, VA, Hydrologic Unit 02080106.
DRAINAGE AREA.--107 square miles.
PERIOD OF RECORD.--October 1961 to September 1999, October 2000 to current year.
DURATION STATISTIC COMPUTATION PERIOD.--All data through September 2015.
REGULATION.--Frequent quarry dewatering adds about 0.5 cfs at times.
GAGE OPERATION.--Virginia Department of Environmental Quality - Water Division.

     Duration Plot with 7-Day Average Streamflow Conditions
Provisional Data Subject to Revision
01671100 plot. 
LITTLE RIVER NEAR DOSWELL, VA
Provisional Data Subject to Revision


The current 7-day running-average value for 03/22/2017 is 102.29 cubic feet per second.

  explanation   Percentile Description Duration Plot Description 28 Day 14 Day 7 Day Daily


      Duration Table of 7-Day Average Streamflow
           
Flow values in cubic feet per second


                01671100     LITTLE RIVER NEAR DOSWELL, VA

   Minimum daily flow
   5th percentile
 
   10th percentile
 
   25th percentile
 
 
   Median
 
 
   75th percentile


   90th percentile


   95th percentile


   Maximum daily flow
         
Years of record
January
9.44
21.4
29.3
60.0
99.0
160
266
358
1,110
 
53
February
11.3
32.7
39.5
67.9
107
173
272
409
1,480
 
53
March
10.7
40.0
53.9
82.6
128
211
329
474
1,550
 
53
April
16.1
38.0
44.7
63.7
101
172
323
416
1,390
 
53
May
9.27
19.3
25.3
40.3
66.0
117
198
326
1,090
 
53
June
2.53
7.14
11.4
19.4
38.1
73.3
121
236
2,010
 
53
July
0.80
2.51
4.40
9.99
18.9
39.3
75.4
121
1,070
 
53
August
0.14
1.17
2.29
5.57
12.2
32.1
64.5
136
2,550
 
53
September
0.36
0.93
1.29
2.76
9.63
26.9
83.2
187
1,380
 
53
October
0.21
0.95
1.43
5.01
16.7
42.1
106
200
1,330
 
52
November
1.16
3.73
9.02
19.4
39.4
82.4
180
298
744
 
53
December
4.47
16.1
20.4
38.4
73.1
135
219
348
846
 
53


The current 7-day running-average value for 03/22/2017 is 102.29 cubic feet per second.

---- Provisional Data Subject to Revision ----

Accessibility FOIA Privacy Policies and Notices

Take Pride in America logo USA.gov logo U.S. Department of the Interior | U.S. Geological Survey
URL: http://va.water.usgs.gov/duration_plots/htm_7/dp01671100.htm
Page Contact Information: Virginia WSC Webmaster
Page Last Modified: 6/19/2016