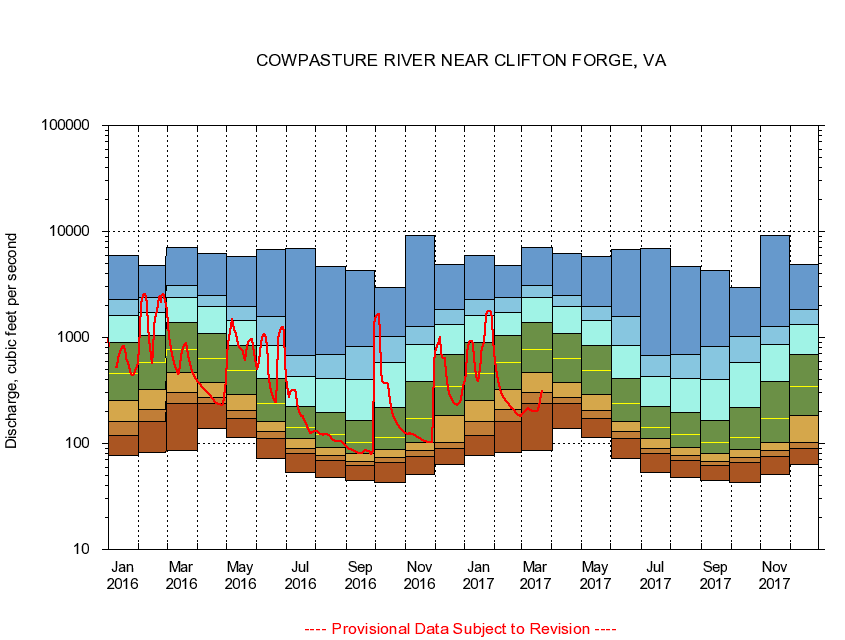
USGS - science for a changing world
Virginia DEQ

Virginia Water Science Center

 
  Duration Plot and Table of 7-Day Average Streamflow
 
02016000 COWPASTURE RIVER NEAR CLIFTON FORGE, VA
LOCATION.--Latitude 37°47'30", Longitude 79°45'35", North American Datum of 1927,
                    Alleghany County, VA, Hydrologic Unit 02080201.
DRAINAGE AREA.--461 square miles.
PERIOD OF RECORD.--March 1925 to current year. Records for May 1907 to August 1908, published in WSP 242, are unreliable and should not be used.
DURATION STATISTIC COMPUTATION PERIOD.--All data through September 2007.
REGULATION.--Occasional withdrawal of water during summer months for the filling of swimming pool at camp 10 to 15 miles above gage.
GAGE OPERATION.--U.S. Geological Survey, Virginia Water Science Center.

     Duration Plot with 7-Day Average Streamflow Conditions
Provisional Data Subject to Revision
02016000 plot. 
COWPASTURE RIVER NEAR CLIFTON FORGE, VA
Provisional Data Subject to Revision


The current 7-day running-average value for 10/14/2008 is 68.29 cubic feet per second.

  explanation   Percentile Description Duration Plot Description 28 Day 14 Day 7 Day Daily


      Duration Table of 7-Day Average Streamflow
           
Flow values in cubic feet per second


                02016000     COWPASTURE RIVER NEAR CLIFTON FORGE, VA

   Minimum daily flow
   5th percentile
 
   10th percentile
 
   25th percentile
 
 
   Median
 
 
   75th percentile


   90th percentile


   95th percentile


   Maximum daily flow
         
Years of record
January
76.7
109
160
261
457
906
1,640
2,300
5,960
 
82
February
82.6
153
209
330
604
1,070
1,760
2,360
4,810
 
82
March
85.4
242
306
464
760
1,390
2,360
3,120
7,010
 
82
April
138
240
272
369
618
1,080
1,930
2,470
6,190
 
82
May
115
168
201
281
449
810
1,310
1,880
5,750
 
82
June
72.7
110
129
162
238
405
864
1,620
6,820
 
82
July
53.6
79.0
89.0
114
146
225
409
672
6,970
 
82
August
48.3
69.3
76.7
91.6
123
203
451
744
4,710
 
82
September
45.0
62.0
67.7
80.5
104
169
422
862
4,250
 
82
October
42.7
65.0
73.4
87.7
116
227
621
1,160
2,940
 
81
November
51.0
75.6
84.7
105
181
409
909
1,300
9,080
 
82
December
63.0
89.3
102
182
344
682
1,300
1,730
4,930
 
82


The current 7-day running-average value for 10/14/2008 is 68.29 cubic feet per second.

---- Provisional Data Subject to Revision ----

Accessibility FOIA Privacy Policies and Notices

Take Pride in America logo USA.gov logo U.S. Department of the Interior | U.S. Geological Survey
URL: http://va.water.usgs.gov/duration_plots/htm_7/dp02016000.htm
Page Contact Information: Virginia WSC Webmaster
Page Last Modified: 9/19/2008