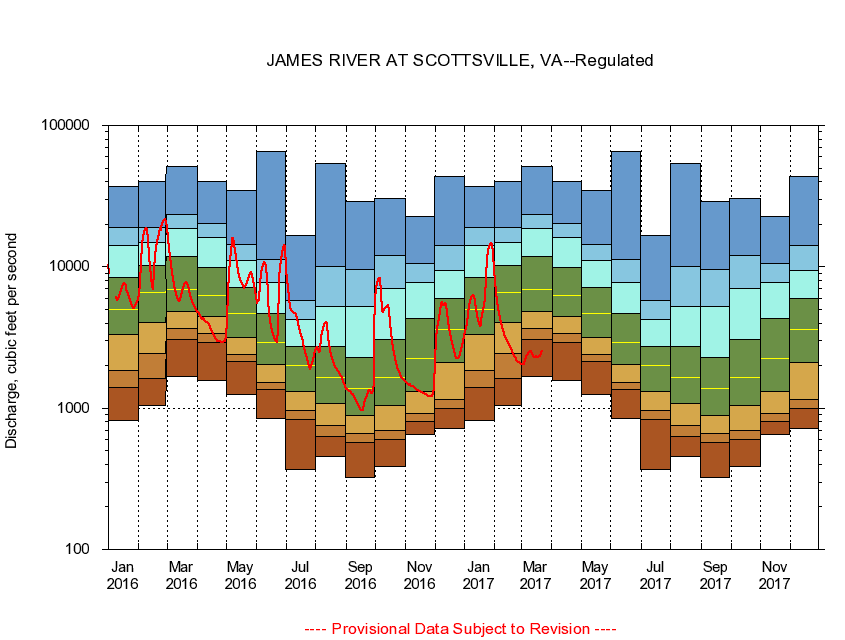
USGS - science for a changing world
Virginia DEQ

Virginia Water Science Center

 
  Duration Plot and Table of 7-Day Average Streamflow
 
02029000 JAMES RIVER AT SCOTTSVILLE, VA
LOCATION.--Latitude 37°47'50", Longitude 78°29'30", North American Datum of 1927,
                    Albemarle County, VA, Hydrologic Unit 02080203.
DRAINAGE AREA.--4,581 square miles.
PERIOD OF RECORD.--October 1924 to current year. Monthly discharge only for some periods, published in WSP 1303.
DURATION STATISTIC COMPUTATION PERIOD.--October 1924 to December 1979.
REGULATION.--Flow regulated since December 1979 by Lake Moomaw 198 miles upstream, since October 1984 by Back Creek Lake 226 miles upstream, and since January 1985 by Little Back Creek Lake 229 miles upstream. Large diurnal fluctuations caused by powerplants upstream of gage during periods of low-flow. Flow augmented by summertime releases since 1982.
GAGE OPERATION.--U.S. Geological Survey, Virginia Water Science Center.

     Duration Plot with 7-Day Average Streamflow Conditions
Provisional Data Subject to Revision
02029000 plot. 
JAMES RIVER AT SCOTTSVILLE, VA
Provisional Data Subject to Revision


The current 7-day running-average value for 03/22/2017 is 2507.14 cubic feet per second.

  explanation   Percentile Description Duration Plot Description 28 Day 14 Day 7 Day Daily


      Duration Table of 7-Day Average Streamflow
           
Flow values in cubic feet per second


                02029000     JAMES RIVER AT SCOTTSVILLE, VA

   Minimum daily flow
   5th percentile
 
   10th percentile
 
   25th percentile
 
 
   Median
 
 
   75th percentile


   90th percentile


   95th percentile


   Maximum daily flow
         
Years of record
January
814
1,390
1,840
3,300
4,990
8,340
14,200
19,100
37,100
 
55
February
1,040
1,620
2,440
4,040
6,560
10,200
14,900
18,900
39,900
 
55
March
1,670
3,060
3,660
4,860
6,960
11,900
18,600
23,600
51,400
 
55
April
1,570
2,910
3,370
4,460
6,300
9,830
16,000
20,200
40,000
 
55
May
1,250
2,130
2,410
3,150
4,650
7,100
11,100
14,400
34,800
 
55
June
842
1,360
1,530
2,050
2,910
4,670
7,790
11,200
66,000
 
55
July
371
834
969
1,310
2,010
2,730
4,210
5,810
16,600
 
55
August
455
633
748
1,080
1,660
2,720
5,220
10,100
53,600
 
55
September
321
568
658
882
1,370
2,300
5,250
9,570
28,800
 
55
October
384
601
700
1,050
1,640
3,050
7,030
12,000
30,300
 
55
November
652
811
924
1,320
2,230
4,330
7,760
10,500
22,600
 
56
December
715
988
1,150
2,090
3,610
5,930
9,470
14,100
43,800
 
55


The current 7-day running-average value for 03/22/2017 is 2507.14 cubic feet per second.

---- Provisional Data Subject to Revision ----

Accessibility FOIA Privacy Policies and Notices

Take Pride in America logo USA.gov logo U.S. Department of the Interior | U.S. Geological Survey
URL: http://va.water.usgs.gov/duration_plots/htm_7/dp02029000.htm
Page Contact Information: Virginia WSC Webmaster
Page Last Modified: 6/19/2016