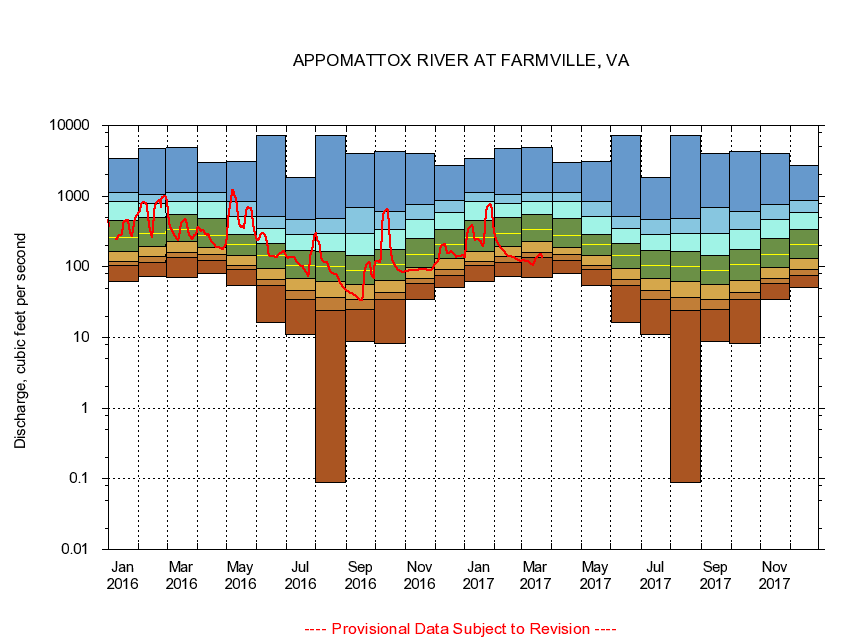
USGS - science for a changing world
Virginia DEQ

Virginia Water Science Center

 
  Duration Plot and Table of 7-Day Average Streamflow
 
02039500 APPOMATTOX RIVER AT FARMVILLE, VA
LOCATION.--Latitude 37°18'25", Longitude 78°23'20", North American Datum of 1927,
                    Cumberland County, VA, Hydrologic Unit 02080207.
DRAINAGE AREA.--302 square miles.
PERIOD OF RECORD.--March 1926 to current year.
DURATION STATISTIC COMPUTATION PERIOD.--All data through September 2015.
REGULATION.--Diurnal fluctuation at low flow caused by mill and disposal plant above station.
GAGE OPERATION.--Virginia Department of Environmental Quality - Water Division.

     Duration Plot with 7-Day Average Streamflow Conditions
Provisional Data Subject to Revision
02039500 plot. 
APPOMATTOX RIVER AT FARMVILLE, VA
Provisional Data Subject to Revision


The current 7-day running-average value for 03/22/2017 is 134.86 cubic feet per second.

  explanation   Percentile Description Duration Plot Description 28 Day 14 Day 7 Day Daily


      Duration Table of 7-Day Average Streamflow
           
Flow values in cubic feet per second


                02039500     APPOMATTOX RIVER AT FARMVILLE, VA

   Minimum daily flow
   5th percentile
 
   10th percentile
 
   25th percentile
 
 
   Median
 
 
   75th percentile


   90th percentile


   95th percentile


   Maximum daily flow
         
Years of record
January
61.1
104
120
163
263
451
843
1,120
3,400
 
89
February
72.1
114
142
196
296
495
783
1,060
4,780
 
89
March
71.0
134
162
228
334
550
849
1,140
4,850
 
89
April
80.6
124
149
190
279
479
845
1,140
2,950
 
89
May
54.0
93.0
106
143
210
287
511
832
3,080
 
90
June
16.4
55.0
65.6
94.3
145
213
352
510
7,160
 
90
July
11.2
34.9
45.7
68.1
105
171
284
461
1,810
 
90
August
0.09
24.0
36.4
61.3
99.9
163
301
480
7,220
 
90
September
8.90
24.7
34.9
55.6
89.6
143
298
700
4,020
 
90
October
8.13
34.7
43.7
64.9
108
174
342
597
4,320
 
89
November
34.7
59.0
67.7
97.9
149
255
471
753
3,980
 
89
December
50.3
75.9
92.0
130
204
339
589
876
2,710
 
89


The current 7-day running-average value for 03/22/2017 is 134.86 cubic feet per second.

---- Provisional Data Subject to Revision ----

Accessibility FOIA Privacy Policies and Notices

Take Pride in America logo USA.gov logo U.S. Department of the Interior | U.S. Geological Survey
URL: http://va.water.usgs.gov/duration_plots/htm_7/dp02039500.htm
Page Contact Information: Virginia WSC Webmaster
Page Last Modified: 6/19/2016