|
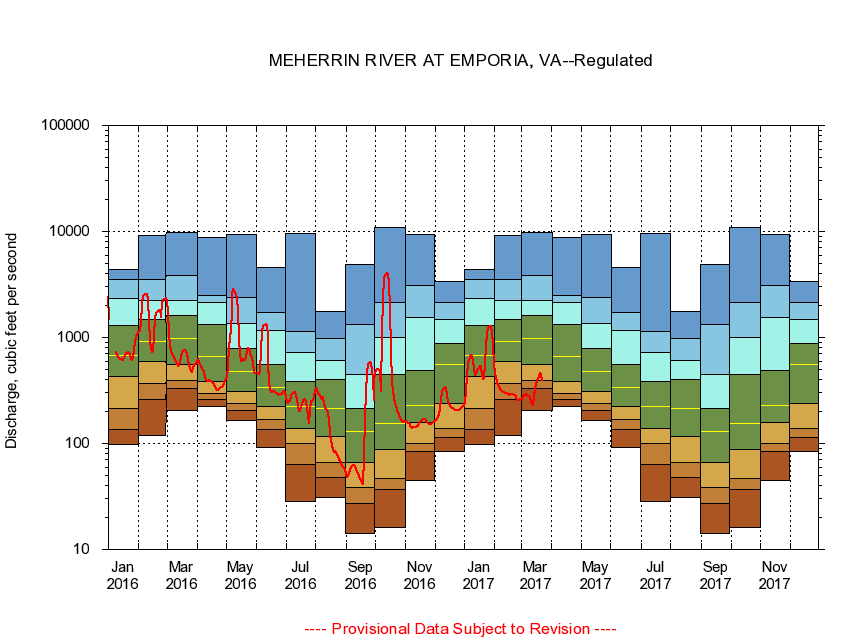
02052000
MEHERRIN RIVER AT EMPORIA, VA
|
Minimum daily flow
|
|
|
5th percentile
|
|
|
|
10th percentile
|
|
|
|
|
25th percentile
|
|
|
|
|
|
Median
|
|
|
|
|
|
|
75th percentile
|
|
|
|
|
|
|
|
90th percentile
|
|
|
|
|
|
|
|
|
95th percentile
|
|
|
|
|
|
|
|
|
|
Maximum daily flow
|
|
|
|
|
|
|
|
|
|
|
|
Years of record
|
January
|
97.3
|
137
|
212
|
432
|
682
|
1,290
|
2,350
|
3,540
|
4,420
|
|
21
|
February
|
119
|
260
|
372
|
600
|
912
|
1,470
|
2,250
|
3,550
|
9,190
|
|
21
|
March
|
207
|
328
|
395
|
559
|
980
|
1,620
|
2,250
|
3,860
|
9,890
|
|
21
|
April
|
224
|
261
|
296
|
385
|
660
|
1,320
|
2,140
|
2,500
|
8,710
|
|
20
|
May
|
164
|
203
|
236
|
310
|
483
|
788
|
1,350
|
2,400
|
9,400
|
|
20
|
June
|
91.3
|
135
|
167
|
225
|
341
|
558
|
1,160
|
1,730
|
4,560
|
|
20
|
July
|
28.4
|
63.0
|
99.5
|
138
|
223
|
385
|
729
|
1,140
|
9,620
|
|
20
|
August
|
30.7
|
47.6
|
65.9
|
116
|
213
|
400
|
608
|
969
|
1,770
|
|
20
|
September
|
14.1
|
27.4
|
38.5
|
66.8
|
131
|
216
|
443
|
1,340
|
4,880
|
|
20
|
October
|
16.0
|
36.8
|
46.6
|
87.1
|
156
|
450
|
993
|
2,150
|
11,000
|
|
20
|
November
|
44.6
|
84.2
|
101
|
157
|
227
|
490
|
1,540
|
3,120
|
9,380
|
|
20
|
December
|
83.4
|
115
|
138
|
239
|
560
|
878
|
1,480
|
2,120
|
3,350
|
|
21
|
|
|
|