USGS - science for a changing world
Virginia DEQ

Virginia Water Science Center

 
  Duration Plot and Table of 7-Day Average Streamflow
 
02058400 PIGG RIVER NEAR SANDY LEVEL, VA
LOCATION.--Latitude 36°56'45", Longitude 79°31'30", North American Datum of 1927,
                    Pittsylvania County, VA, Hydrologic Unit 03010101.
DRAINAGE AREA.--351 square miles, (measured on USGS topographic maps).
PERIOD OF RECORD.--June 1963 to current year.
DURATION STATISTIC COMPUTATION PERIOD.--All data through September 2015.
REGULATION.--Small amount of diurnal fluctuation; cause unknown.
GAGE OPERATION.--U.S. Geological Survey, Virginia Water Science Center.

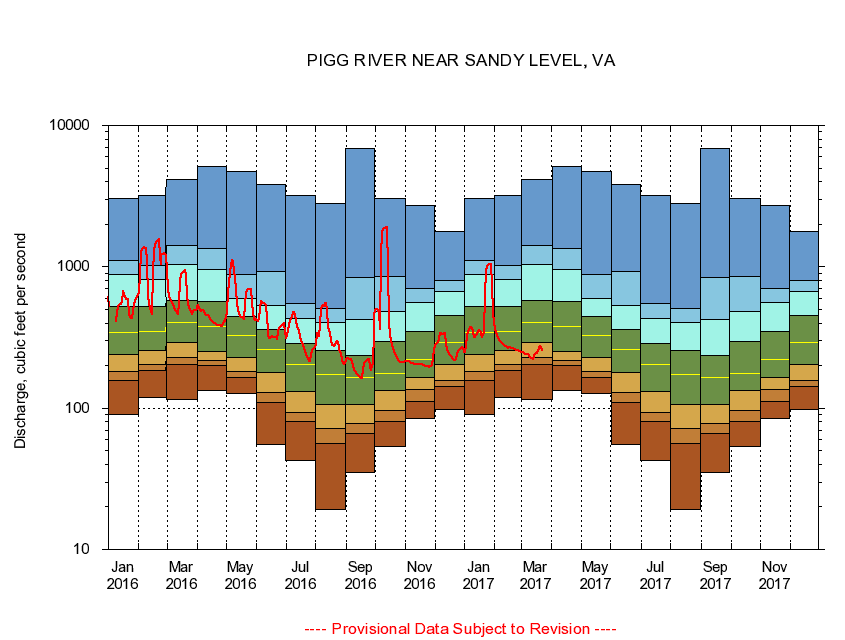
     Duration Plot with 7-Day Average Streamflow Conditions
Provisional Data Subject to Revision
02058400 plot. 
PIGG RIVER NEAR SANDY LEVEL, VA
Provisional Data Subject to Revision


The current 7-day running-average value for 03/22/2017 is 257.14 cubic feet per second.

  explanation   Percentile Description Duration Plot Description 28 Day 14 Day 7 Day Daily


      Duration Table of 7-Day Average Streamflow
           
Flow values in cubic feet per second


                02058400     PIGG RIVER NEAR SANDY LEVEL, VA

   Minimum daily flow
   5th percentile
 
   10th percentile
 
   25th percentile
 
 
   Median
 
 
   75th percentile


   90th percentile


   95th percentile


   Maximum daily flow
         
Years of record
January
90.4
158
183
238
341
523
886
1,100
3,030
 
52
February
119
185
205
255
350
524
818
1,020
3,200
 
52
March
116
204
228
293
404
577
1,040
1,410
4,120
 
52
April
134
201
216
250
378
567
960
1,350
5,120
 
52
May
127
164
183
227
329
442
595
886
4,710
 
52
June
55.0
109
130
179
261
360
529
930
3,820
 
52
July
42.3
80.6
93.2
131
203
285
432
551
3,200
 
53
August
19.1
56.3
71.3
107
172
254
403
504
2,790
 
53
September
35.1
66.0
78.0
107
165
234
427
840
6,930
 
53
October
53.4
80.6
96.2
133
177
296
486
861
3,040
 
52
November
84.3
111
135
164
220
346
559
707
2,720
 
52
December
97.7
143
157
205
291
454
669
802
1,790
 
52


The current 7-day running-average value for 03/22/2017 is 257.14 cubic feet per second.

---- Provisional Data Subject to Revision ----

Accessibility FOIA Privacy Policies and Notices

Take Pride in America logo USA.gov logo U.S. Department of the Interior | U.S. Geological Survey
URL: http://va.water.usgs.gov/duration_plots/htm_7/dp02058400.htm
Page Contact Information: Virginia WSC Webmaster
Page Last Modified: 6/19/2016