|
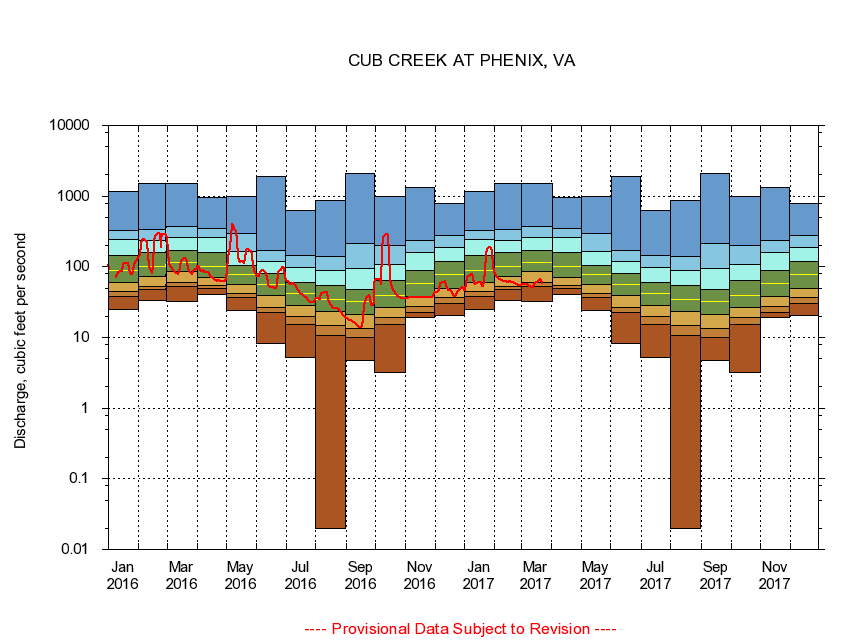
02065500
CUB CREEK AT PHENIX, VA
|
Minimum daily flow
|
|
|
5th percentile
|
|
|
|
10th percentile
|
|
|
|
|
25th percentile
|
|
|
|
|
|
Median
|
|
|
|
|
|
|
75th percentile
|
|
|
|
|
|
|
|
90th percentile
|
|
|
|
|
|
|
|
|
95th percentile
|
|
|
|
|
|
|
|
|
|
Maximum daily flow
|
|
|
|
|
|
|
|
|
|
|
|
Years of record
|
January
|
24.7
|
38.4
|
45.3
|
60.1
|
89.3
|
143
|
245
|
329
|
1,180
|
|
69
|
February
|
33.1
|
47.8
|
52.6
|
72.0
|
102
|
159
|
235
|
341
|
1,520
|
|
69
|
March
|
32.4
|
52.6
|
60.9
|
84.6
|
114
|
172
|
263
|
373
|
1,530
|
|
69
|
April
|
40.6
|
49.3
|
55.0
|
71.5
|
100
|
159
|
260
|
350
|
969
|
|
69
|
May
|
24.4
|
37.3
|
41.9
|
57.1
|
79.0
|
105
|
167
|
297
|
991
|
|
69
|
June
|
8.10
|
22.5
|
26.7
|
39.9
|
56.8
|
80.3
|
120
|
173
|
1,910
|
|
69
|
July
|
5.19
|
15.4
|
19.9
|
28.0
|
42.0
|
60.9
|
98.6
|
144
|
624
|
|
69
|
August
|
0.02
|
10.8
|
14.9
|
23.1
|
34.3
|
54.3
|
89.1
|
138
|
871
|
|
69
|
September
|
4.73
|
9.98
|
13.3
|
21.0
|
32.6
|
48.3
|
94.6
|
216
|
2,120
|
|
69
|
October
|
3.16
|
15.5
|
19.4
|
26.3
|
39.1
|
64.6
|
109
|
201
|
990
|
|
68
|
November
|
18.9
|
22.7
|
27.4
|
37.7
|
58.5
|
88.9
|
157
|
239
|
1,340
|
|
69
|
December
|
20.7
|
30.4
|
37.1
|
48.9
|
77.7
|
119
|
190
|
280
|
795
|
|
69
|
|
|
|