|
03170000
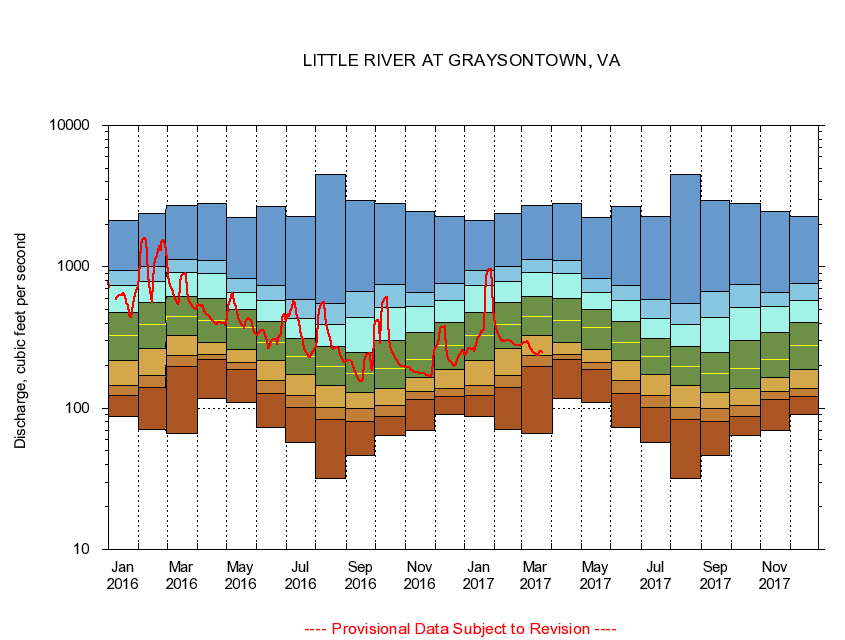
LITTLE RIVER AT GRAYSONTOWN, VA
|
Minimum daily flow
|
|
|
5th percentile
|
|
|
|
10th percentile
|
|
|
|
|
25th percentile
|
|
|
|
|
|
Median
|
|
|
|
|
|
|
75th percentile
|
|
|
|
|
|
|
|
90th percentile
|
|
|
|
|
|
|
|
|
95th percentile
|
|
|
|
|
|
|
|
|
|
Maximum daily flow
|
|
|
|
|
|
|
|
|
|
|
|
Years of record
|
January
|
86.9
|
122
|
145
|
216
|
328
|
474
|
734
|
941
|
2,120
|
|
87
|
February
|
71.0
|
141
|
170
|
266
|
389
|
557
|
783
|
1,000
|
2,380
|
|
87
|
March
|
66.0
|
197
|
236
|
327
|
445
|
618
|
906
|
1,130
|
2,710
|
|
87
|
April
|
117
|
220
|
239
|
292
|
416
|
597
|
895
|
1,100
|
2,790
|
|
87
|
May
|
110
|
187
|
209
|
262
|
370
|
503
|
654
|
822
|
2,250
|
|
87
|
June
|
73.1
|
128
|
156
|
218
|
293
|
409
|
582
|
741
|
2,680
|
|
87
|
July
|
56.7
|
101
|
122
|
172
|
232
|
309
|
430
|
589
|
2,280
|
|
87
|
August
|
32.0
|
82.7
|
101
|
144
|
197
|
272
|
389
|
549
|
4,480
|
|
87
|
September
|
46.3
|
80.6
|
98.9
|
129
|
175
|
247
|
440
|
672
|
2,950
|
|
87
|
October
|
64.3
|
86.9
|
104
|
138
|
190
|
303
|
514
|
749
|
2,820
|
|
86
|
November
|
69.6
|
115
|
131
|
165
|
222
|
341
|
523
|
658
|
2,480
|
|
87
|
December
|
90.0
|
121
|
137
|
187
|
279
|
406
|
582
|
760
|
2,270
|
|
87
|
|
|
|