|
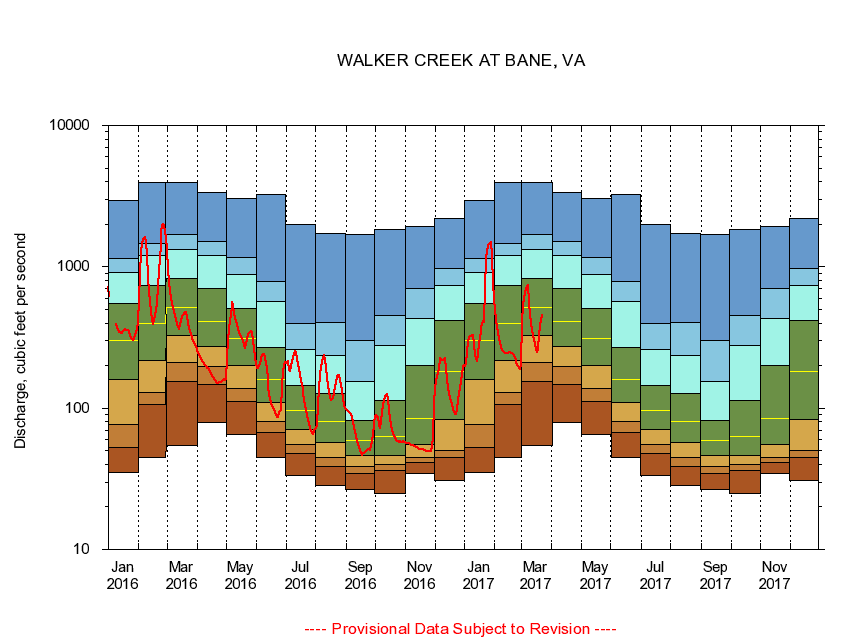
03173000
WALKER CREEK AT BANE, VA
|
Minimum daily flow
|
|
|
5th percentile
|
|
|
|
10th percentile
|
|
|
|
|
25th percentile
|
|
|
|
|
|
Median
|
|
|
|
|
|
|
75th percentile
|
|
|
|
|
|
|
|
90th percentile
|
|
|
|
|
|
|
|
|
95th percentile
|
|
|
|
|
|
|
|
|
|
Maximum daily flow
|
|
|
|
|
|
|
|
|
|
|
|
Years of record
|
January
|
35.0
|
52.9
|
77.1
|
160
|
303
|
549
|
905
|
1,140
|
2,960
|
|
77
|
February
|
44.9
|
106
|
129
|
216
|
397
|
740
|
1,200
|
1,470
|
3,960
|
|
77
|
March
|
54.0
|
154
|
211
|
328
|
519
|
833
|
1,320
|
1,700
|
3,960
|
|
77
|
April
|
79.1
|
148
|
196
|
272
|
412
|
700
|
1,200
|
1,510
|
3,370
|
|
77
|
May
|
65.4
|
112
|
138
|
200
|
310
|
505
|
876
|
1,160
|
3,040
|
|
78
|
June
|
45.0
|
67.7
|
80.3
|
109
|
159
|
270
|
572
|
789
|
3,270
|
|
78
|
July
|
33.6
|
47.4
|
54.9
|
70.9
|
96.0
|
144
|
260
|
400
|
2,000
|
|
78
|
August
|
28.6
|
38.6
|
44.6
|
56.7
|
80.1
|
128
|
237
|
401
|
1,710
|
|
78
|
September
|
26.4
|
34.7
|
38.4
|
46.4
|
59.4
|
82.0
|
155
|
300
|
1,680
|
|
78
|
October
|
25.0
|
36.0
|
40.0
|
46.3
|
63.3
|
114
|
276
|
454
|
1,850
|
|
77
|
November
|
34.3
|
41.6
|
45.1
|
55.2
|
85.1
|
201
|
430
|
698
|
1,940
|
|
77
|
December
|
30.9
|
45.0
|
50.3
|
83.7
|
182
|
420
|
737
|
981
|
2,200
|
|
77
|
|
|
|