USGS - science for a changing world
Virginia DEQ

Virginia Water Science Center

 
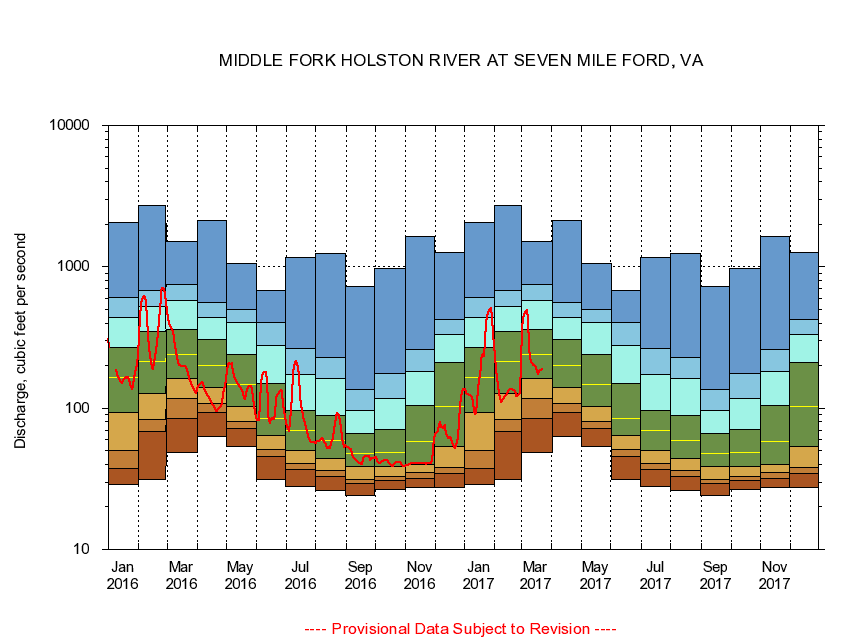
  Duration Plot and Table of 7-Day Average Streamflow
 
03474000 MIDDLE FORK HOLSTON RIVER AT SEVEN MILE FORD, VA
LOCATION.--Latitude 36°48'26", Longitude 81°37'20", North American Datum of 1927,
                    Smyth County, VA, Hydrologic Unit 06010102.
DRAINAGE AREA.--132 square miles.
PERIOD OF RECORD.--July 1942 to December 1981, October 1987 to September 1989, October 1996 to current year.
DURATION STATISTIC COMPUTATION PERIOD.--All data through September 2015.
REGULATION.--Some diurnal fluctuation at low flow caused by mill 9 miles above station, prior to April 1977. Since May 1936, flow occasionally regulated by the filling and draining of Hungry Mother Lake on Hungry Mother Creek, capacity about 1,600 ac ft.
GAGE OPERATION.--U.S. Geological Survey, Virginia Water Science Center.

     Duration Plot with 7-Day Average Streamflow Conditions
Provisional Data Subject to Revision
03474000 plot. 
MIDDLE FORK HOLSTON RIVER AT SEVEN MILE FORD, VA
Provisional Data Subject to Revision


The current 7-day running-average value for 03/22/2017 is 188.71 cubic feet per second.

  explanation   Percentile Description Duration Plot Description 28 Day 14 Day 7 Day Daily


      Duration Table of 7-Day Average Streamflow
           
Flow values in cubic feet per second


                03474000     MIDDLE FORK HOLSTON RIVER AT SEVEN MILE FORD, VA

   Minimum daily flow
   5th percentile
 
   10th percentile
 
   25th percentile
 
 
   Median
 
 
   75th percentile


   90th percentile


   95th percentile


   Maximum daily flow
         
Years of record
January
29.0
37.7
50.4
93.9
166
270
435
603
2,060
 
60
February
31.1
68.3
82.8
126
214
347
525
685
2,710
 
60
March
48.4
84.6
117
162
239
360
581
746
1,520
 
60
April
62.9
92.6
108
140
202
308
438
562
2,120
 
60
May
53.7
72.2
80.1
103
148
241
405
497
1,060
 
60
June
31.4
45.6
50.9
63.6
85.1
149
276
403
676
 
60
July
28.0
36.6
40.3
50.3
69.5
96.6
172
265
1,160
 
60
August
26.3
33.1
36.0
43.7
59.0
88.8
162
229
1,240
 
60
September
24.1
29.3
31.3
38.4
47.4
66.7
96.1
136
724
 
60
October
26.6
30.6
32.9
38.7
48.9
70.9
117
177
978
 
60
November
27.3
32.0
34.9
40.0
57.7
105
182
259
1,650
 
61
December
27.3
34.3
38.1
53.7
102
209
331
424
1,270
 
61


The current 7-day running-average value for 03/22/2017 is 188.71 cubic feet per second.

---- Provisional Data Subject to Revision ----

Accessibility FOIA Privacy Policies and Notices

Take Pride in America logo USA.gov logo U.S. Department of the Interior | U.S. Geological Survey
URL: http://va.water.usgs.gov/duration_plots/htm_7/dp03474000.htm
Page Contact Information: Virginia WSC Webmaster
Page Last Modified: 6/19/2016