|
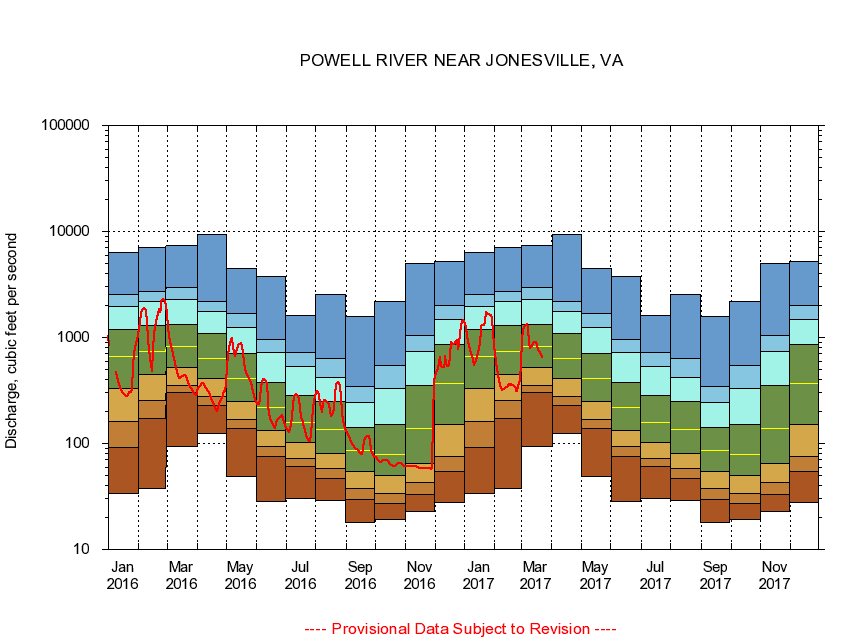
03531500
POWELL RIVER NEAR JONESVILLE, VA
|
Minimum daily flow
|
|
|
5th percentile
|
|
|
|
10th percentile
|
|
|
|
|
25th percentile
|
|
|
|
|
|
Median
|
|
|
|
|
|
|
75th percentile
|
|
|
|
|
|
|
|
90th percentile
|
|
|
|
|
|
|
|
|
95th percentile
|
|
|
|
|
|
|
|
|
|
Maximum daily flow
|
|
|
|
|
|
|
|
|
|
|
|
Years of record
|
January
|
33.7
|
91.5
|
160
|
330
|
660
|
1,180
|
1,940
|
2,540
|
6,340
|
|
84
|
February
|
37.9
|
173
|
256
|
445
|
741
|
1,290
|
2,180
|
2,730
|
7,140
|
|
84
|
March
|
92.7
|
302
|
356
|
518
|
815
|
1,340
|
2,260
|
2,980
|
7,410
|
|
84
|
April
|
125
|
227
|
277
|
410
|
632
|
1,080
|
1,760
|
2,170
|
9,280
|
|
84
|
May
|
49.1
|
138
|
167
|
250
|
412
|
710
|
1,240
|
1,680
|
4,460
|
|
84
|
June
|
28.1
|
75.9
|
94.3
|
133
|
218
|
377
|
727
|
956
|
3,760
|
|
84
|
July
|
30.0
|
61.0
|
72.6
|
103
|
159
|
281
|
529
|
718
|
1,620
|
|
84
|
August
|
29.3
|
46.6
|
57.6
|
80.2
|
136
|
250
|
415
|
636
|
2,560
|
|
84
|
September
|
18.0
|
29.4
|
37.6
|
54.3
|
85.3
|
143
|
244
|
343
|
1,580
|
|
84
|
October
|
19.1
|
27.0
|
33.6
|
50.3
|
78.9
|
151
|
330
|
539
|
2,180
|
|
83
|
November
|
23.0
|
33.0
|
43.3
|
64.9
|
138
|
349
|
731
|
1,050
|
4,940
|
|
84
|
December
|
27.7
|
54.5
|
76.2
|
151
|
369
|
856
|
1,470
|
2,020
|
5,190
|
|
84
|
|
|
|