Photograph
by Michael Eckenwiler, USGS
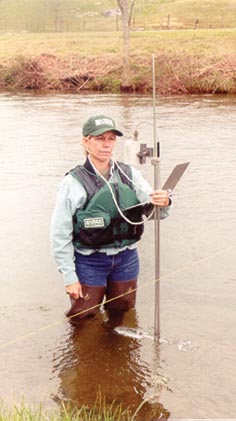
Figure
1. Locations
of the 161 continuous-record streamflow-gaging stations in Virginia in 2002,
jointly operated by the U.S. Geological Survey and the Virginia Department
of Environmental Quality.
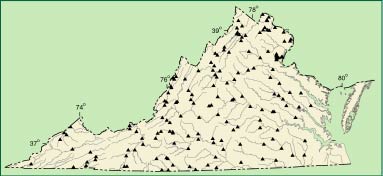
Figure
2. The
Rapidan River in north-central Virginia after the flood of June 1995. The
concrete gagehouse was broken by the force of the water, which was 30 feet
higher during the peak of the flood (approximately 100,000 cubic feet per
second) than its normal level (139 cubic feet per second) as shown in the
photograph.
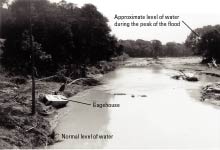
Figure
3. Discharge
measurement being made from a cable suspended above the stream. Cableway
measurements are made when the stream is too wide or too deep to make a
wading measurement.
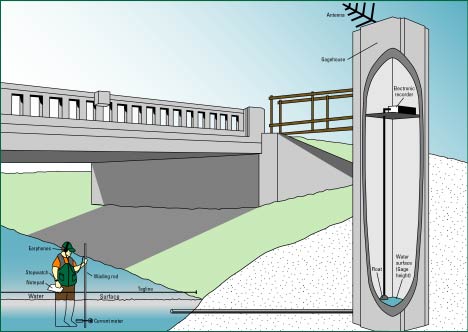
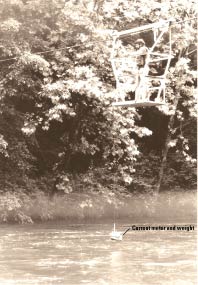
Figure
4. Diagram
of a technician making a wading measurement, and a gagehouse. The wading rod
is graduated in tenths of a foot and is used
to
measure the depth of the stream. Earphones are used to hear the revolutions
of the current meter. The stopwatch is used to measure an interval
of time
during which the revolutions of the current meter are counted. A tagline is
like a measuring tape and is used to measure the distance
from
streambank to streambank. The antenna on top of the gagehouse transmits the
gage-height records to a satellite; the data are then relayed
back to
earth, providing real-time data.
The Virginia Department of Environmental Quality:
Mission Statement
The Department of Environmental Quality is dedicated to protecting Virginia's environment and promoting the health and well-being of the citizens of the Commonwealth. We accomplish this by planning and implementing environmental programs, and by resolving issues efficiently, openly, fairly and consistently.
The U.S. Geological Survey:
Mission Statement
The USGS serves the Nation by providing reliable scientific information to:
-
describe and understand the Earth;
-
minimize loss of life and property from natural
disasters;
-
manage water, biological, energy, and mineral
resources; and
-
enhance and protect our quality of life.
For more information, contact either of the following:
Eugene Powell, Environmental
Engineer, Sr.
Department of Environmental Quality
900 Natural Resources Drive
Suite 600, Charlottesville, Virginia 22903
Phone (434) 293-3031
Fax (434) 977-6751
District Chief
U.S. Geological Survey
1730 East Parham Road
Richmond, Virginia 23228
Phone: (804) 261-2600 (or) 1-800-684-1592
Fax (804) 261-2657
For more information on all USGS reports and products (including maps, images, and digital data), call 1-888-ASK-USGS.
The president of the American Society of Civil
Engineers states “...consulting engineers in the private sector, in
addition to engineers working at all levels of government, rely on the
unbiased and objective scientific information and data provided by [the
USGS].”
|
Measuring Streamflow in Virginia
By Roger M. Moberg and Karen C. Rice,
U.S. Geological Survey, and
Eugene D. Powell,
Virginia Department of Environmental Quality
Introduction
The U.S. Geological Survey (USGS), U.S. Department of the Interior, is the Nation's largest Earth-
science information agency. Among its many responsibilities, such as map making and providing information on earthquakes and other natural hazards, the USGS provides information on the Nation's water resources. The USGS has collected and analyzed hydrologic (water-related) information for more than 100 years. In 1889, the first streamflow-gaging station (a site where regular observations of stream-flow data are collected) operated in the United States by the USGS was established on the Rio Grande near Embudo, New Mexico. As the need for streamflow data increased, the USGS's streamflow-gaging program has grown to include more than 7,000 continuous-record streamflow-gaging stations. More than 90 percent of these stations are operated with at least partial support from State, local, or other Federal agencies.
In Virginia, the Department of Environmental Quality (DEQ) is a major cooperator in the streamflow-gaging program, which consists of 161 continuous-record streamflow-gaging stations located throughout the State (fig. 1). The USGS and DEQ cooperate to publish the annual USGS State data report,
"Water Resources Data-Virginia;" this two-volume publication includes streamflow data collected at the 161 streamflow-gaging stations, chemical data collected at 19 streamflow-gaging stations, and
ground-water data collected from more than 250 wells located in Virginia.
Why Does the USGS Measure Streamflow?
Data collected at streamflow-gaging stations across the Nation are used extensively by the general public, Federal, State, and local agencies, consultants, and industry to make a wide variety of decisions:
-
recreationists, who may want to know whether river conditions are safe and desirable for a river-rafting trip or a fishing
trip;
- the National Weather Service, to forecast flow on major rivers and streams, especially flood flows(fig. 2)-long-term streamflow data (collected continuously for several decades) are essential for accurately assessing the magnitude of
floods;
-
the U.S. Army Corps of Engineers, to establish permits for water releases from reservoirs to maintain minimum in-stream flows;
-
water-supply utility companies, to help determine when to withdraw water from rivers or reservoirs, especially during droughts, and to plan for future water supplies;
-
electric utility companies, to determine the best time to operate reservoirs to generate electricity in order to balance inflows and outflows of reservoirs;
-
the Virginia Department of Transportation and the Federal Highway Administration, to aid in the design of bridges, culverts, roads, and dams;
-
regulatory agencies, such as DEQ, to establish discharge permits for the discharge of treated wastewater, and water-withdrawal permits for water-treatment plants that supply water for consumers; and
-
consultants and university researchers, to aid in the development of TMDLs (total maximum daily loads) for specific waterways.
How Does the USGS Measure Streamflow?
In order to measure streamflow, the depth and width of a stream and the velocity (speed at which water travels) need to be determined. The area (depth multiplied by the width) multiplied by the velocity gives the discharge (volume of water per unit of time) that passes a given location along a stream. A discharge measurement, then, is a measurement of the volume of water that passes a given stream cross section (total width of the stream) within a given period of time.
Three types of discharge measurements are made by USGS and DEQ technicians on a stream: wading, suspension, and boat. A wading measurement is made by a technician who walks into the water on foot (see cover photograph). A suspension measurement is made by a technician from a bridge (bridge measurement) or a cable (cableway measurement) that crosses the stream (fig. 3). A boat measurement is made by a technician in a boat when a bridge or cable is not available. Using the latest technology-an acoustic Doppler current profiler (ADCP)-the technician can make discharge measurements from a boat, bridge, or cableway. Acoustic technology allows the technician to measure a wide range of streamflows accurately without wading into the stream.
The wading measurement is still the most common type of discharge measurement and requires the use of a current meter, wading rod, earphones, stopwatch, tagline, and notepad (fig. 4). To make a wading measurement, the technician divides the cross section into small units, called "stations." At each station, the technician measures the depth of the stream, the width of the station, and the velocity of the water by use of the current meter. A current meter, similar to a wind-speed measuring device, consists of a wheel with six rotating cups that slides up and down the wading rod. The technician records the number of
revolutions of the current meter and the elapsed time on a notepad for each station; the greater the number of revolutions of the current meter, the greater the velocity of the water. These records are used to calculate the velocity of the water at each station. The technician then multiplies the depth of the stream, in feet, by the distance between each station, in feet, by the velocity of the water at each station, in feet per second. The product of the three numbers gives the discharge for that station, in cubic feet per second. The discharges calculated for all of the stations are then summed to get the total discharge for the stream at the cross section.
Continuous measurements of water level of the stream are made inside a
gagehouse. A
typical gagehouse is a concrete structure located on the bank of a stream, with a pipe extending into the stream (fig. 4). The pipe allows water from the stream to enter the gagehouse so that the gage height (level of the water surface in the gagehouse) is equal to that of the stream. Inside the gagehouse, electronic devices record the gage height, usually at 15-minute intervals. These gage-height records are transmitted via telephone or satellite to the USGS office in Richmond. These data are processed and made available on the Web in near real-time (updated at 1- to 4-hour intervals). The many uses of streamflow data are enhanced by making these data available quickly to a wide audience. Recreationists can get current information to plan their outings. During floods, real-time streamflow data contribute to saving lives and property. Gage-height records and real-time data are provisional (subject to revision after
review). The data can be accessed by clicking the "Real-Time Streamflow Data" link on the Virginia District home page at va.water.usgs.gov. After review, the data are published annually in "Water Resources
Data-Virginia."
The continuous gage-height records along with the discharge
measurements made by the technician are used to create a rating table (a chart showing the relation of gage height to discharge) for a stream. Rating tables are used to estimate the discharge of the stream by using only the gage-height
records collected from the gagehouse. The advantage of having a rating table for a stream is that once the gage height is known, the discharge can be inferred without having to go to the stream and make a discharge measurement. Over time, however, the relation between the gage height and discharge can change, requiring periodic discharge measurements to be made to redefine that relation.
|
|