 |
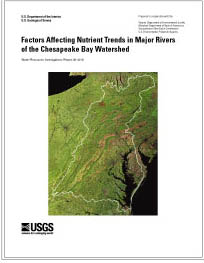
Factors Affecting Nutrient Trends in Major Rivers of the Chesapeake Bay WatershedWater Resources Investigations Report 00-4218 |
Download the report in PDF (For best results, use Adobe Acrobat 4.0)
ABSTRACT
Trends in nutrient loads and flow-adjustedconcentrations in the major rivers entering Chesapeake Bay were computed on the basis of water-quality data collected between 1985 and 1998 at 29 monitoring stations in the Susquehanna, Potomac, James, Rappahannock, York, Patuxent, and Choptank River Basins. Two computer models—the Chesapeake Bay Watershed Model (WSM) and the U.S. Geological Survey’s "Spatially Referenced Regressions on Watershed attributes" (SPARROW) Model—were used to help explain the major factors affecting the trends. Results from WSM simulations provided information on temporal changes in contributions from major nutrient sources, and results from SPARROW model simulations provided spatial detail on the distribution of nutrient yields in these basins. Additional data on nutrient sources, basin characteristics, implementation of management practices, and ground-water inputs to surface water were analyzed to help explain the trends.
The major factors affecting the trends were changes in nutrient sources and natural variations in streamflow. The dominant source of nitrogen and phosphorus from 1985 to 1998 in six of the seven tributary basins to Chesapeake Bay was determined to be agriculture. Because of the predominance of agricultural inputs, changes in agricultural nutrient sources such as manure and fertilizer, combined with decreases in agricultural acreage and implementation of best management practices (BMPs), had the greatest impact on the trends in flow-adjusted nutrient concentrations. Urban acreage and population, however, were noted to be increasing throughout the Chesapeake Bay Watershed, and as a result, delivered loads of nutrients from urban areas increased during the study period. Overall, agricultural nutrient management, in combination with load decreases from point sources due to facility upgrades and the phosphate detergent ban, led to downward trends in flow-adjusted nutrient concentrations atmany of the monitoring stations in the watershed. The loads of nutrients, however, were not reduced significantly at most of the monitoring stations. This is due primarily to higher streamflow in the latter years of the monitoring period, which led to higher loading in those years.
Results of this study indicate a need for more detailed information on BMP effectiveness under a full range of hydrologic conditions and in different areas of the watershed; an internally consistent fertilizer data set; greater consideration of the effects of watershed processes on nutrient transport; a refinement of current modeling efforts; and an expansion of the non-tidal monitoring network in the Chesapeake Bay Watershed.
| For more information, contact | ||
| Virginia District U.S. Geological Survey 1730 E. Parham Road Richmond, Virginia 23228 (804) 261-2600 |
Maryland District U.S. Geological Survey 8987 Yellow Brick Road Baltimore, Maryland 21237 (410) 238-4200 |
Pennsylvania District U.S. Geological Survey 840 Market Street Lemoyne, Pennsylvania 17043 (717) 730-6900 |
|
|
| To order printed copies, contact |
|
U.S. Geological Survey Information Services Box 25286, Federal Center Denver, CO 80225 1-888-ASK-USGS |
Return to the Virginia District Home Page
| USGS | Water | Biology | Geology | Mapping | On-Line Water Resources Investigations Reports | On-Line Water-Resources Reports |
|
U.S. Department of the Interior, U.S. Geological Survey
Maintainer: Virginia District Publications Last update: 12:01:22 Fri 15 Dec 2000 Privacy Statement || Disclaimer URL: http://va.water.usgs.gov/online_pubs/WRIR/00-4218.htm |

|