
Highlights
|
IntroductionChesapeake Bay is the largest estuary in the United States, supporting an abundant and diverse wildlife population and providing thousands of jobs in fishing, shipping, and recreation. Intensive agriculture and continued development in the region, however, have degraded the water quality of the Bay, threatening its value as an economic and recreational resource. Nutrients such as nitrogen and phosphorus are the pollutants of greatest concern affecting the Bay. Although nutrients are necessary for plant and animal life, in excess quantities they overnourish algae, causing algal blooms. These blooms deprive deeper waters of the sunlight and oxygen needed by aquatic organisms. Suspended sediment is another pollutant of concern; it decreases water clarity and transports bound nutrients. In response to the environmental problems of the Bay, representatives of the Chesapeake Bay Commission, the District of Columbia, the States of Maryland, Pennsylvania, and Virginia, and the U.S. Environmental Protection Agency signed the Chesapeake Bay Agreement in 1987. This agreement committed Federal, State, and other agencies to work toward a 40-percent reduction in controllable nitrogen and phosphorus inputs (based on 1985 levels) to the Bay by the year 2000. In the mid-1980’s, the U.S. Geological Survey (USGS), the Maryland Department of the Environment (now part of the Maryland Department of Natural Resources), the Virginia Department of Environmental Quality (VDEQ), and the Metropolitan Washington Council of Governments (MWCOG) established the River Input Monitoring (RIM) Program to quantify the loads and long-term trends in concentrations of nutrients and suspended sediment that enter the tidal part of the Chesapeake Bay Basin from its nine major tributaries (fig. 1). Results of the RIM program are being used to help evaluate the effectiveness of strategies aimed at reducing nutrients entering Chesapeake Bay from its tributaries. 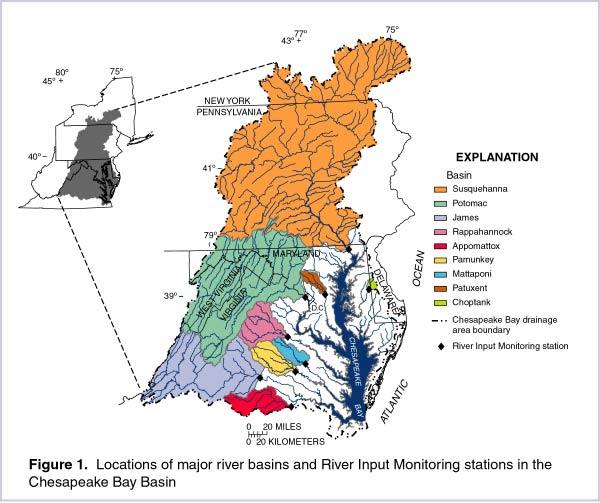
|
Between 1985 and 1998, the USGS collected water samples from nine RIM stations, which collectively represent about 93 percent of the streamflow from the nontidal part of the 64,000-mi2 (square mile) Chesapeake Bay Basin. Water samples were collected monthly or bimonthly and during storms at each station for periods spanning from 8 to 14 years. In Virginia and Maryland, supplemental water samples were collected by the VDEQ and MWCOG, respectively.
Nutrient concentrations, loads, and trends observed at the RIM stations are an important gauge of progress in reducing nutrient inputs to Chesapeake Bay from its tributaries. These data also are used to calibrate the Chesapeake Bay Watershed Model, a computer simulation of watershed processes encompassing the entire Chesapeake Bay Basin. Progress towards the 40-percent controllable nutrient reduction goal is estimated periodically using this model, which accounts for both point and nonpoint sources of nutrients. Data from the RIM stations and other monitoring locations throughout the Chesapeake Bay Basin should be considered in conjunction with the results of model simulations to evaluate improvement in the water quality of Chesapeake Bay and its tributaries.
Nutrients are required by all plant and animal life. Sources of nutrients to streams are both natural and human-derived, and include decaying organic material; fertilizers applied to crops, lawns, and golf courses; manure from fields or feedlots; atmospheric deposition in the form of precipitation or dry deposition; ground-water discharge; and municipal wastewater discharge (fig. 2).
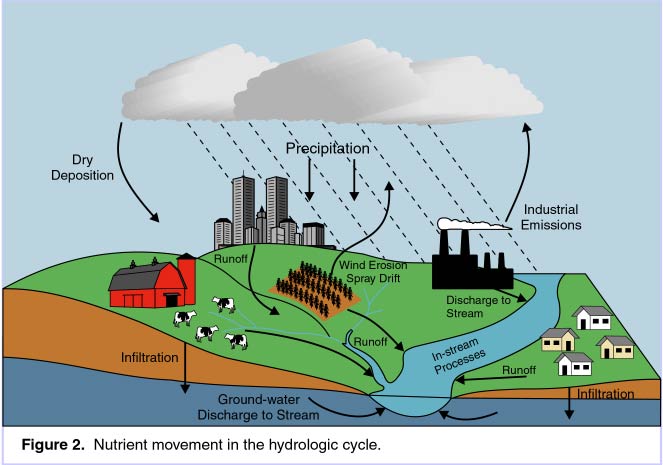 |
Point sources of nutrients can be attributed to a single location, such as a wastewater discharge pipe. Nonpoint sources of nutrients are widely distributed over an area, and may include precipitation, runoff from fields and urban areas, and ground water discharged to streams. In-stream processes affect concentrations of nutrients by transforming one chemical form to another as a result of environmental conditions or biological activity in the stream. These transformations can make it difficult to determine the specific sources of the nutrients. Nutrients enter Chesapeake Bay from streams, ground water that discharges to the Bay, and atmospheric deposition. Elevated nutrient concentrations cause excessive algae growth, which decreases the amount of sunlight reaching the submerged aquatic vegetation that provides an important habitat and food source for fish and wildlife. Decaying algae consume dissolved oxygen; reduced oxygen levels will stress fish, crabs, molluscs, and other aquatic organisms. It is expected that achieving the 40-percent nutrient- reduction goal will greatly reduce algal blooms in the Bay, resulting in improved water clarity, increased submerged aquatic vegetation acreage, and higher oxygen levels year round. |
The major nutrient control strategies that have been used in the Chesapeake Bay Basin include the following:
Upgrades to wastewater treatment plants. Municipal and industrial wastewater treatment plants are the principal point sources of nutrients to streams. In response to the Federal Water Pollution Control Act of 1972 and the Water Quality Act of 1987, State and local governments have increasingly supported consolidation of treatment plants and the use of more effective technology in treatment of wastewater, including biological nutrient removal.
The ban of phosphate detergents. As replacements to phosphorus in detergents were found, detergents containing phosphate were taken off the market. By the late 1980’s, phosphate detergents were banned in all the States that surround Chesapeake Bay.
The implementation of best management practices (BMP’s). Engineering and agricultural BMP’s are designed to minimize surface runoff of nutrients and suspended material reaching streams from nonpoint sources such as highways, construction sites, farms, and urban areas. Some BMP’s, however, can increase nutrient concentrations reaching streams through ground water by diverting runoff away from streams, instead allowing nutrient-rich water to infiltrate to ground water that will eventually discharge to a stream. Because ground water moves slowly, this process may take many years, making the effect of the BMP difficult to assess. Additionally, BMP’s are voluntary for landowners, are not easily monitored, and have different impacts in different geographic settings, which further complicates this assessment.
| USGS
station number |
Station Name | Upstream land surface area (mi2) | Land Use (percent) | Major upstream wastewater discharges (Mgal/day) | |||
| Urban | Agricultural | Forested | Other | ||||
| Susquehanna River near Conowingo, Md. | |||||||
| 01646580 | Potomac River at Chain Bridge, Washington D.C. | ||||||
| 02035000 | James River at Cartersville, Va. | ||||||
| 01668000 | Rappahannock River near Fredericksburg, Va. | ||||||
| 02041650 | Appomattox River at Matoaca, Va. | ||||||
| 01673000 | Pamunkey River near Hanover, Va. | |
|||||
| 01674500 | Mattaponi near Beulahville, Va. | ||||||
| 01594440 | Patuxent River at Bowie, Md. | ||||||
| 01491000 | Choptank River near Greensboro, Md. | ||||||
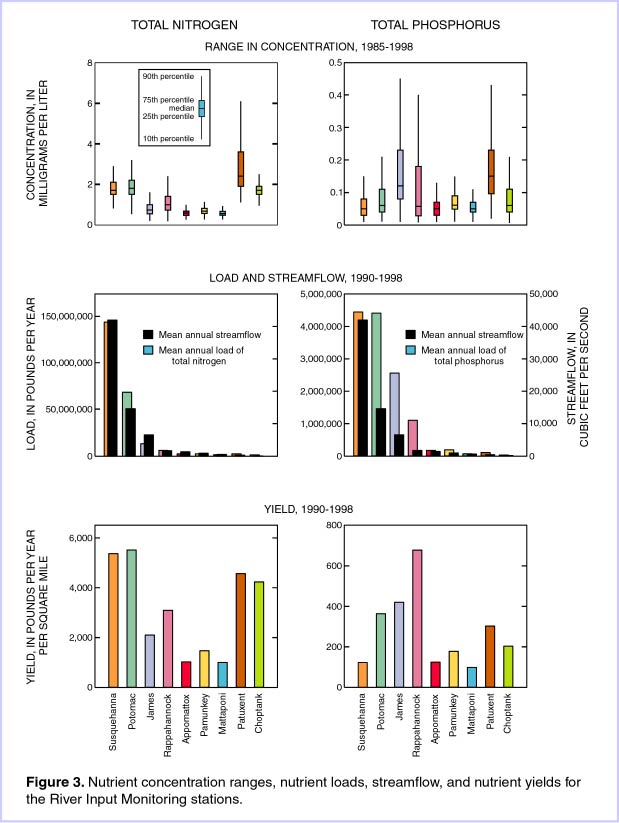
Several measures are used to quantify amounts of nutrients, including concentration, load, and yield. Concentration, or analyzed mass of nutrient per volume of water (usually reported in milligrams per liter, or mg/L), is used to assess in-stream conditions at the monitoring stations. Nutrient concentrations can differ from stream to stream because of differences in land use, geology, streamflow, point sources, and other factors in the drainage basin. The relative percentages of different land uses and the estimated discharge from wastewater treatment plants upstream from each RIM station (table 1) indicate how possible nutrient sources in the nine major basins compare. Load is the mass of nutrient transported by streamflow over time, and is estimated as the product of nutrient concentration and streamflow (reported here in pounds per year, or lbs/yr). The three rivers that have the highest flow—the Susquehanna, the Potomac, and the James Rivers—contribute the largest nutrient loads to the tidal part of the Chesapeake Bay Basin. Yield is the load per unit area of each basin (reported in pounds per year per square mile, or lbs/yr/mi2), and is computed by dividing load by basin area. Because the influence of basin area on load is removed, yield is more useful than load in comparing nutrient contributions from basins of different sizes. The nutrient concentration, load, and yield for the nine major rivers draining to Chesapeake Bay are shown in figure 3 in order of decreasing basin area.
 |
Trends are overall increases or decreases in a measurement such as concentration during a specified period. Trends in nutrient concentrations can be affected by nutrient control strategies, which manage point and nonpoint sources in an effort to achieve downward trends. In many cases, concentration trends are also affected by natural processes, especially streamflow. If a point source, such as discharge from a wastewater treatment plant, is the dominant nutrient source to a stream, dilution from an increase in streamflow would cause a downward trend in nutrient concentrations. In contrast, if a nonpoint source, such as runoff from agricultural land, is the dominant nutrient source, increased streamflow from an increase in storm runoff would cause an upward trend in nutrient concentrations. Often, a decrease in nutrient concentrations resulting from a BMP can be offset by an increase in concentrations resulting from higher streamflow.
The removal of streamflow as a variable affecting in-stream concentrations of nutrients in a trend analysis allows trends caused by other factors to be identified, and the effects of nutrient control strategies to be assessed. These flow-adjusted concentration trends are independent of variation in streamflow. When considering the health of aquatic organisms in Chesapeake Bay and its tributaries, however, trends due to both streamflow and nutrient control strategies must be examined, as both influence the overall state of the ecosystem. These unadjusted concentration trends account for all factors that affect trends in nutrient concentrations.
Data collected from the mid-to-late 1980’s through 1998 were used to identify trends in total nitrogen and total phosphorus concentrations at the RIM stations. Trends in streamflow and concentrations of suspended material, which transports bound nutrients, also were identified; these may provide additional insight into nutrient trends. Both the unadjusted and flow-adjusted concentration trends are presented in figure 4 as 95-percent confidence intervals—the interval in which there is a 95-percent probability that the true trend falls. Directions of flow-adjusted concentration trends are presented for each drainage basin in figure 5, and directions of unadjusted concentration trends are presented in figure 6. Directions of trends in streamflow are presented for each drainage basin in figure 7. A detailed discussion of the methodologies and results of the trend analyses is presented in Langland and others (1999).
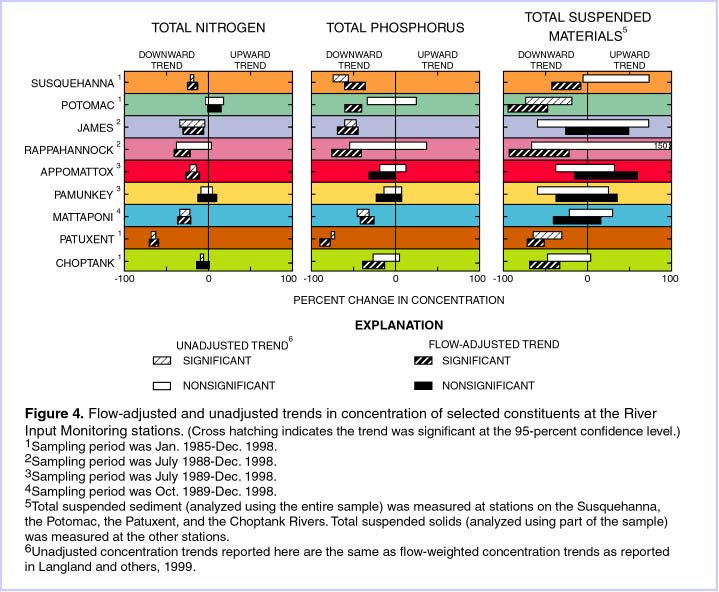 |
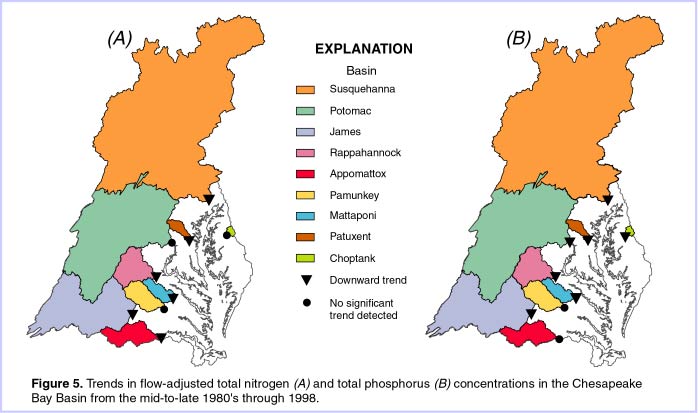 figure 5 figure 5 |
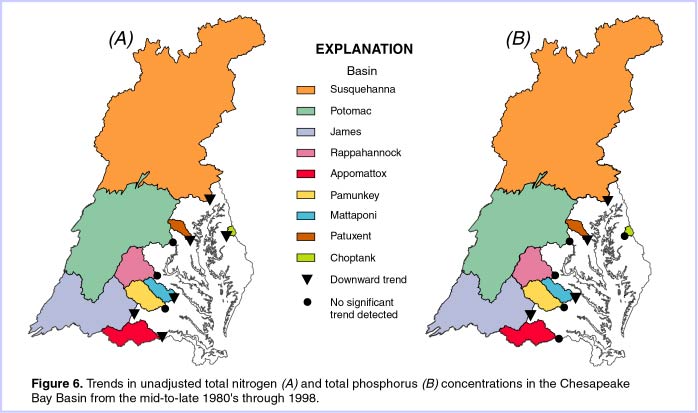 figure 6 figure 6 |
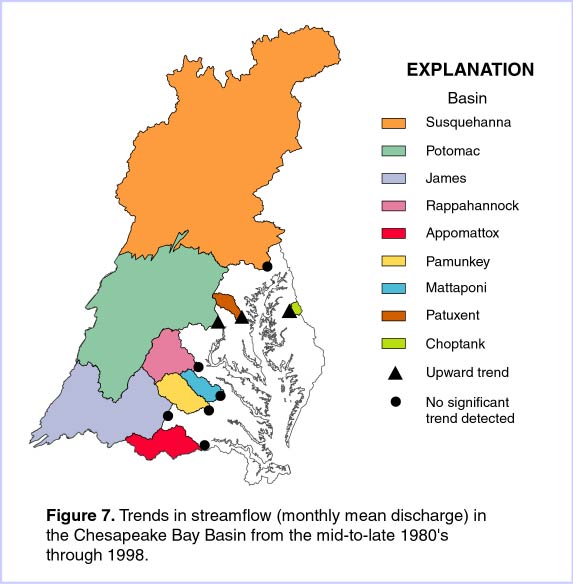 figure 7 figure 7 |
The Susquehanna River monitoring station is at the Conowingo Dam Hydroelectric Power Plant in Conowingo, Md. The station is approximately 10 miles from the river mouth and receives streamflow from 99 percent of the 27,510-mi2 Susquehanna River Basin. The Susquehanna River is the largest river draining to the Bay and contributes about 60 percent of the total streamflow, 62 percent of the total nitrogen load, and 34 percent of the total phosphorus load from the nontidal part of the Chesapeake Bay Basin.
The Susquehanna River drains parts of New York, Pennsylvania, and Maryland, and includes some of the most productive agricultural land in the nation. Agricultural activity is extensive in the lower Susquehanna River Basin, contributing to the high yield of nitrogen (fig. 3). However, the phosphorus yield was low, because phosphorus tends to bind to sediment particles that settle to the river bottom and become trapped behind Conowingo Dam (Langland and Hainly, 1997).
The flow-adjusted concentration of total nitrogen decreased about 12 to 25 percent at the Susquehanna River monitoring station during 1985-98 (fig. 4). The implementation of agricultural and forestry BMP’s may be partly responsible for the decrease in total nitrogen. The unadjusted concentration of total nitrogen also decreased about 20 percent. Trends in flow-adjusted and unadjusted concentrations were comparable because there was no significant increase in flow at this station during 1985-98 (fig. 7) to offset the effects of nutrient control strategies in the basin.
The flow-adjusted concentration of total phosphorus decreased about 36 to 60 percent during the 14-year monitoring period. Inputs from point sources, although not major contributors to the total phosphorus load at the Susquehanna River monitoring station, decreased by 56 percent (Darrell and others, 1999). The decrease in phosphorus may be partly attributed to the phosphate detergent ban and to agricultural BMP’s. There was a 57 to 75 percent decrease in unadjusted total phosphorus concentration.
The Potomac River is the second largest river draining to the Bay and the second largest source of nitrogen and phosphorus. It contributes about 20 percent of the total streamflow, 28 percent of the total nitrogen load, and 33 percent of the total phosphorus load from the nontidal part of the Chesapeake Bay Basin. The Potomac River monitoring station, at Chain Bridge in Washington, D.C., receives streamflow from 80 percent of the 14,670-mi2 Potomac River Basin. Because the monitoring station lies upstream from the municipal wastewater discharges in the Metropolitan Washington, D.C., area, water-quality characteristics and trends discussed in this report do not reflect contributions or changes in these wastewater discharges.
During the period 1985-98, the flow-adjusted concentration of total nitrogen at the Potomac River monitoring station did not show a significant trend (fig. 4), even though inputs from point sources of nitrogen above the station were reduced by about 10 percent during the 14-year period (Darrell and others, 1999). The unadjusted concentration of total nitrogen also did not show a significant trend, even though streamflow increased during that period (fig. 7). The flow-adjusted phosphorus concentration decreased about 40 to 60 percent during the 14-year period. Point source inputs of phosphorus above the monitoring station were reduced by about 28 percent (Darrell and others, 1999), largely due to the phosphate detergent ban. Nonpoint source inputs of phosphorus also were reduced. Because phosphorus tends to bind to sediment, the decrease in both phosphorus and suspended material (fig. 4) may indicate the effectiveness of BMP’s aimed at controlling sediment erosion. The success of these nutrient control strategies on total phosphorus concentration was offset by the increase in flow, however, as the unadjusted total phosphorus concentration did not decrease significantly.
The James River monitoring station, at Cartersville, Va., receives streamflow from about 60 percent of the 10,200-mi2 James River Basin. It is located upstream from municipal wastewater discharges in the Richmond, Va., area. Of the nine rivers monitored, it contributes about 12 percent of the streamflow, 5 percent of the total nitrogen load, and 20 percent of the total phosphorus load, making it the third largest nutrient and streamflow source after the Susquehanna and the Potomac Rivers. The James River Basin has the second largest yield of total phosphorus in the nontidal part of the Chesapeake Bay Basin (fig. 3). The relatively large phosphorus yield is caused by both point and nonpoint sources, including wastewater treatment plants, high concentrations bound to sediment in agricultural runoff, and naturally high concentrations from soils and rocks.
A downward trend of about 44 to 69 percent in the flow-adjusted concentration of total phosphorus was detected at the James River monitoring station during the period 1988-98 (fig. 4). This downward trend was more evident in low-flow conditions than in high-flow conditions (Bell and others, 1996), and most of the decrease occurred during 1988-90, soon after the phosphate detergent ban was implemented in Virginia. This suggests that point-source reductions were the most effective nutrient control strategy in this basin during the period monitored. The unadjusted total phosphorus concentration decreased about 48 to 61 percent.
During the 11-year monitoring period, the flow-adjusted concentration of total nitrogen in the James River decreased about 5 to 30 percent. With no significant increase in streamflow (fig. 7) to offset the effects of BMP’s, the unadjusted concentration of total nitrogen also decreased about 4 to 34 percent.
The Rappahannock River monitoring station, upstream from Fredericksburg, Va., receives streamflow from about 57 percent of the 2,800-mi2 Rappahannock River Basin. This river contributes about 3 percent of the total streamflow, 2 percent of the total nitrogen load, and 8 percent of the total phosphorus load delivered annually from the nontidal part of the Chesapeake Bay Basin. The Rappahannock River Basin has the largest percentage of agricultural land among the five monitored river basins in Virginia and the third largest of all nine basins(table 1). Nonpoint sources contribute more than 90 percent of the nutrient load in this basin, although a few point sources also are present. Steep slopes and abundant pastureland in the basin cause the Rappahannock River to produce high yields of suspended material and the highest yield of total phosphorus (fig. 3).
The flow-adjusted concentrations of total nitrogen and total phosphorus decreased at the Rappahannock River monitoring station about 21 to 41 percent and 41 to 76 percent, respectively, during the period 1988-98 (fig. 4). The implementation of agricultural and forestry BMP’s potentially was a major factor in these trends. The Virginia Department of Conservation and Recreation estimates that between 1985 and 1993 there was about an 11 percent decrease in nitrogen and about an 18 percent decrease in phosphorus from nonpoint sources (Mark Bennett, Virginia Department of Conservation and Recreation, written commun., 1996). Any decrease in phosphorus concentration as a consequence of the phosphate detergent ban probably would not have been evident because of the limited number of point sources in the basin upstream from the monitoring station.
The unadjusted concentrations of total nitrogen and total phosphorus did not change significantly during the 11-year monitoring period, indicating that natural streamflow variations and increasing development in this basin may have offset nutrient reductions resulting from the implementation of BMP’s.
The Appomattox River monitoring station, at Matoaca, Va., receives streamflow from approximately 84 percent of the 1,600-mi2 Appomattox River Basin. This river contributes about 2 percent of the total streamflow, less than 1 percent of the total nitrogen load, and 1 percent of the total phosphorus load delivered annually from the nontidal part of the Chesapeake Bay Basin. Sediment with bound nutrients settles behind Lake Chesdin Dam, 2.8 miles upstream from the monitoring station, contributing to the second smallest yields of total phosphorus and total nitrogen of the nine major basins (fig. 3).
Flow-adjusted total nitrogen concentrations decreased about 10 to 27 percent during the period 1989-98 (fig. 4). Unadjusted total nitrogen concentrations decreased about 14 to 22 percent. The similarity between these values results from a lack of increase in streamflow during this period (fig. 7). The implementation of agricultural BMP’s may be partly responsible for the decrease in total nitrogen. There were no significant trends in either flow-adjusted or unadjusted total phosphorus concentrations during the 10-year monitoring period. Because nonpoint sources contribute almost all of the nutrient load to the river, the phosphate detergent ban had little effect on phosphorus concentration trends.
The Pamunkey and Mattaponi Rivers join below the Pamunkey River monitoring station to form the York River, which flows to Chesapeake Bay. The Pamunkey River monitoring station, near Hanover, Va., receives streamflow from about 45 percent of the 2,400-mi2 York River Basin. The Pamunkey River contributes about 2 percent of the total streamflow, less than 1 percent of the total nitrogen load, and 2 percent of the total phosphorus load delivered annually from the nontidal part of the Chesapeake Bay Basin. The basin has the third smallest yield of total nitrogen and the fourth smallest yield of total phosphorus (fig. 3). The basin is relatively flat, contains expanses of forested wetlands and marshes, and receives nutrients from both nonpoint and point sources, including agricultural runoff and discharge from wastewater treatment plants.
No significant trends in flow-adjusted or unadjusted concentrations of total nitrogen or total phosphorus were evident at the Pamunkey River monitoring station during the period 1989-98 (fig. 4).
The Mattaponi River monitoring station, near Beulahville, Va., receives streamflow from about 25 percent of the 2,400-mi2 York River Basin. The Mattaponi River contributes less than 1 percent of the total streamflow, the total nitrogen load, and the total phosphorus load delivered annually from the nontidal part of the Chesapeake Bay Basin. The Mattaponi River Basin is relatively flat and contains expanses of wetland areas. Because of the small area and low relief of this basin, the Mattaponi River has the second smallest annual load of both total nitrogen and total phosphorus, after the Choptank River (fig. 3); however, yields of total nitrogen and total phosphorus from the Mattaponi River are the smallest. Nonpoint sources contribute most of the nutrients to the river.
Both flow-adjusted and unadjusted total nitrogen concentrations decreased about 20 to 35 percent during the period 1989-1998 (fig. 4). Both flow-adjusted and unadjusted total phosphorus concentrations decreased about 30 to 45 percent during the 10-year monitoring period. The similarity between these values reflects the lack of a significant increase in streamflow during this period (fig. 7). Because of the small number of point sources in the Mattaponi River Basin, the decreases in total nitrogen and total phosphorus concentrations probably were caused by changes in nonpoint sources or in-stream processes.
The Patuxent River monitoring station, in Bowie, Md., receives streamflow from about 37 percent of the 932-mi2 Patuxent River Basin. The basin lies completely within Maryland, between Baltimore and Washington, D.C., in an area of increasing urbanization. The Patuxent River contributes less than 1 percent of the total streamflow, the total nitrogen load, and the total phosphorus load delivered annually from the nontidal part of the Chesapeake Bay Basin. Water quality is strongly affected by urban runoff and by eight wastewater treatment plants upstream from the station. Because it is affected by relatively large number of point sources, the Patuxent River has the highest median concentrations of total nitrogen and total phosphorus, as well as relatively large yields for both nutrients (fig. 3).
The flow-adjusted concentration of total nitrogen decreased about 60 to 70 percent during 1985-98 (fig. 4). Within the same period, point source inputs of nitrogen were reduced by 53 percent (Darrell and others, 1999), largely as a result of implementation of biological nutrient removal at major wastewater treatment plants between 1991 and 1993. Nutrient control strategies apparently have been particularly effective in this basin, as an increase in streamflow during the 14-year period did not offset these improvements. Unadjusted concentrations of total nitrogen also decreased about 63 to 68 percent.
The flow-adjusted concentration of total phosphorus decreased about 78 to 90 percent during the 14-year monitoring period (fig. 4). Inputs of phosphorus from point sources were reduced by about 75 percent during this period, largely due to the phosphate detergent ban. Increased streamflow (fig. 7) offset total phosphorus reductions more than total nitrogen reductions, but the unadjusted total phosphorus concentration still decreased about 72 to 76 percent during the 14-year period.
The Choptank River monitoring station, in Greensboro, Md., receives streamflow from about 14 percent of the 795-mi2 Choptank River Basin. The Choptank River is the largest river on Maryland’s Eastern Shore, but contributes less than 1 percent of the streamflow, the total nitrogen load, and the total phosphorus load delivered annually from the nontidal part of the Chesapeake Bay Basin. Land use in the basin is primarily agricultural, producing the fourth largest yield of total nitrogen and the fifth largest yield of total phosphorus (fig. 3).
For the period 1985-98, the flow-adjusted concentration of total nitrogen did not change significantly while the unadjusted concentration of total nitrogen decreased about 6 to 9 percent (fig. 4). The flow-adjusted concentration of total phosphorus decreased about 13 to 39 percent during the 14-year period. This decrease likely is a function of the approximately 50-percent decrease in the flow-adjusted concentration of total suspended material (fig. 4). No known point sources of nutrients exist upstream of the monitoring station on the Choptank River; therefore, these decreases are probably due to nonpoint-source reductions. The unadjusted total phosphorus concentration did not reflect the improvements from these nutrient control strategies, as no significant decrease was detected. This was likely a result of increased streamflow during the monitoring period (fig. 7).
Many of the major rivers draining to Chesapeake Bay are showing significant progress toward the goal of a 40-percent reduction in controllable nutrients mandated by the Chesapeake Bay Agreement in 1987. The effects of BMP’s are being observed across the Bay basin, but natural increases in streamflow during the monitoring period have often counteracted these improvements. In some rivers, however, significant reductions have not been achieved.
As the States of Maryland, Pennsylvania, and Virginia, and the District of Columbia assess their progress toward the nutrient-reduction goal, they will implement tributary strategies for the nontidal areas of Chesapeake Bay, including the areas monitored by the River Input Monitoring Program (Virginia Secretary of Natural Resources and others, 1998; Maryland Department of Natural Resources and others, 1999). These strategies contain specific plans for reducing nutrients in individual river basins, and are expected to lead to substantial reductions in nutrients reaching Chesapeake Bay from its tributaries in coming years.
Bell, C.F., Belval, D.L., and Campbell, J.P., 1996, Trends in nutrients and suspended solids at the Fall Line of five tributaries to the Chesapeake Bay, Virginia, July 1988 through June 1995: U.S. Geological Survey Water-Resources Investigations Report 96-4191, 37 p. Darrell, L.C., Feit-Majedi, B., Lizarraga, J.S., and Blomquist, J.D., 1999, Nutrient and suspended-sediment concentrations, trends, loads, and yields from the non-tidal part of the Susquehanna, Potomac, Patuxent, and Choptank Rivers, 1985-96: U.S. Geological Survey Water Resources Investigations Report 98-4177, 39 p. Langland, M.J., and Hainly, R.A., 1997, Changes in bottom-surface elevations in three reservoirs on the lower Susquehanna River, Pennsylvania and Maryland, following the January 1996 flood: Implications for nutrient and sediment loads to the Chesapeake Bay: U.S. Geological Survey Water-Resources Investigations Report 97-4138, 34 p. Langland, M.J., Blomquist, J.D., Sprague, L.A., and Edwards, R.E., 1999, Trends and status of flow, nutrients, and sediments for selected nontidal programs in the Chesapeake Bay Watershed, 1985-98: U.S. Geological Survey Open-File Report 99-451, 64 p. Maryland Department of Natural Resources, Maryland Department of Agriculture, Maryland Department of the Environment, Maryland Office of Planning, and the University of Maryland, 1999, Maryland’s tributary teams: Annual Report 1998, 94 p. Virginia Secretary of Natural Resources, Virginia Department of Conservation and Recreation, and Virginia Department of Environmental Quality, 1998, Third annual report on the development and implementation of nutrient reduction strategies for Virginia’s tributaries to the Chesapeake Bay, 100 p. Vogelmann, J.E., Sohl, T.L., Campbell, P.V., and Shaw, D.M., 1998, Regional land cover characterization using Landsat Thematic Mapper data and ancillary data sources, Third EMAP Research Symposium, Albany, N.Y., April 8-11, 1997, Environmental Monitoring and Assessment, v. 51, p. 415-428. |
FOR MORE INFORMATION For more information on USGS activities in Virginia and Maryland, please contact the following: District Chief District Chief Or visit our web sites at: http://va.water.usgs.gov/ http://md.water.usgs.gov/ Additional information and data from the River Input Monitoring Program can be found at: http://va.water.usgs.gov/chesbay/RIMP/ Information on USGS activities in the Chesapeake Bay Region can be found at: http://chesapeake.usgs.gov/ Information on other Federal, State, and Citizen Programs can be found on the EPA’s Chesapeake Bay Home Page at: http://www.chesapeakebay.net/ For more information on USGS services and products, call: 1-888-ASK-USGS or visit the USGS Home Page at: http://www.usgs.gov/ |