

Provisional Assessment of Hydrologic Conditions in Virginia
February 15, 2002
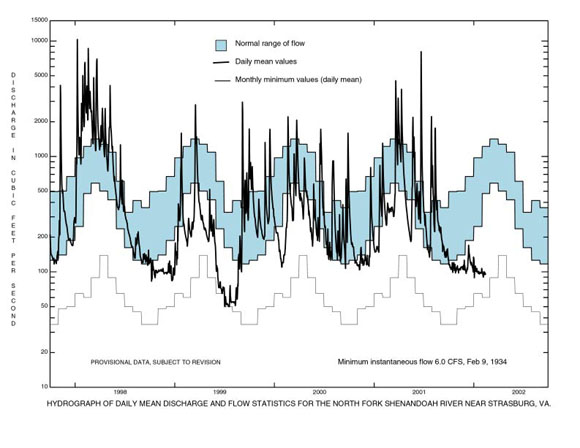
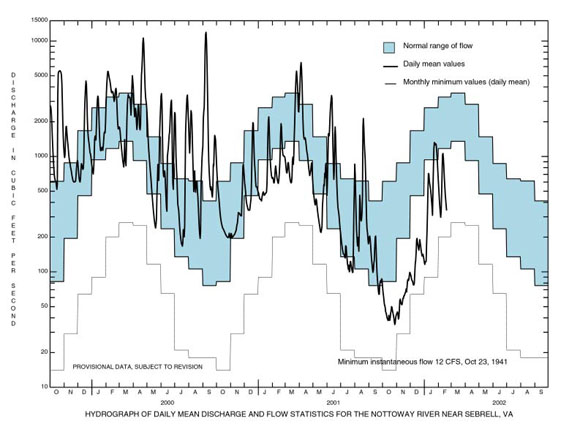
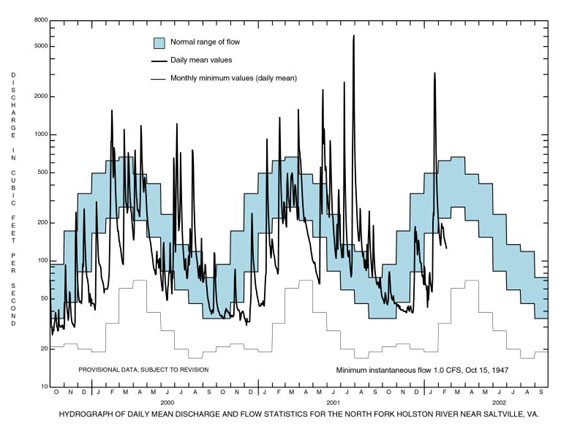
Streamflows across the State are well below the normal range of flow expected
during winter
months despite recent snow and rain. Streamflows are at levels expected during
the late fall
months when flows generally are at annual minimums.
At some streamgages, record minimums
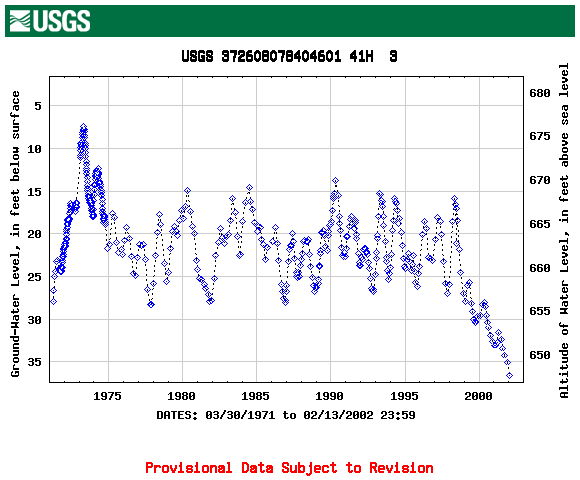
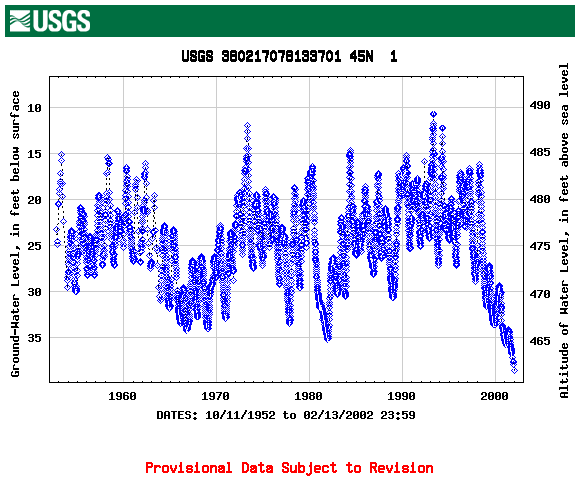
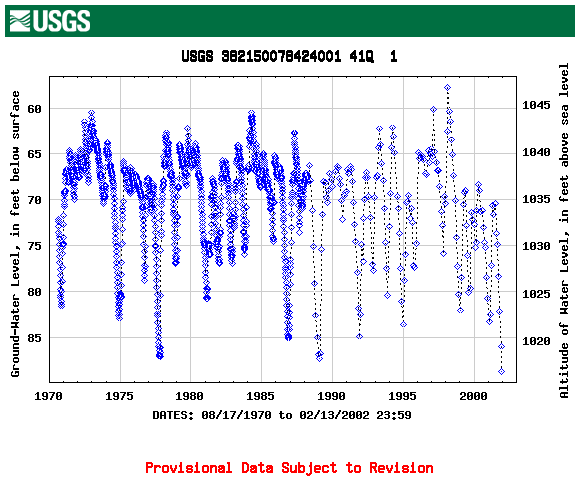
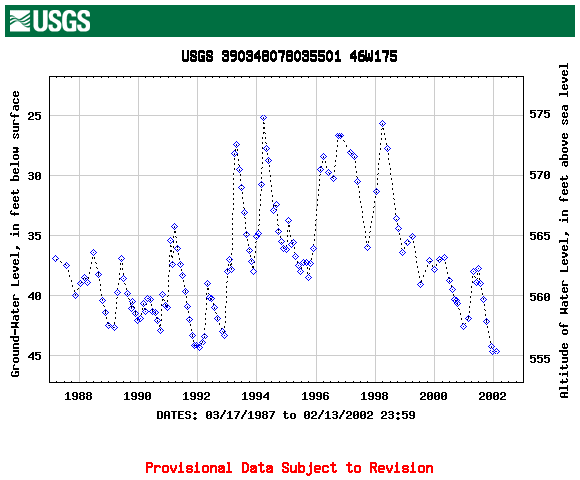
for the month can be expected. Ground-water storage (as indicated by well
levels) is well below
conditions expected during winter months.
Current hydrologic drought conditions result from precipitation patterns over
the past several
years. The current Statewide drought began in the summer of 1997.
Precipitation was well
below normal during the summer and fall of 1997, allowing streamflows to decline
to levels
below the normal range of flows. Precipitation was well above normal during the
winter of
1998, increasing groundwater storage and streamflow to levels above the normal
range of
flows. During the summer and fall of 1998, precipitation again was well below
normal, causing
a significant agricultural drought; however streamflows never declined to below
normal levels
until late fall because of the unusually high ground-water storage.
Ground-water storage was
not replenished significantly during the winter of 1999 and new record minimums
were recorded
during the summer of that year. Hurricanes
Dennis and Floyd brought significant precipitation
during the fall of 1999 which boosted ground-water storage in the eastern half
of the State.
During the winters of 2000 and 2001, precipitation did not replenish the
ground-water storage
to the extent normally expected, and well levels have continued to decline.
Precipitation patterns
during the summers of 2000 and 2001 have allowed streamflows to maintain
conditions near the
normal range of flow.
The following graphs and table give flow duration and current flow
conditions for selected U.S.
Geological Survey and Virginia Department of Environmental Quality ground-water
and surface-water
gaging stations. Data are
provisional and subject to revision. The
normal range of flows is defined as
flows in the middle two quartiles (between those flows equaled or exceeded 75
percent of the time and
those flows equaled or exceeded 25 percent of the time).
| BUCKINGHAM COUNTY WELL |
 |
| LOUISA COUNTY WELL |
 |
| ROCKINGHAM COUNTY WELL |
 |
| CLARKE COUNTY WELL |
 |
| HYDROGRAPH, NORTH FORK SHENANDOAH RIVER NEAR STRASBURG, VA |
 |
| HYDROGRAPH, NOTTOWAY RIVER NEAR SEBRELL, VA |
 |
| HYDROGRAPH, NORTH FORK HOLSTON RIVER NEAR SALTVILLE, VA |
 |
USGS--Water Resources of Virginia
Contact: GS-W-VArmd_webmaster@usgs.gov
U.S. Department of Interior,
U.S. Geological Survey
Privacy Statement
Disclaimer
URL://va.water.usgs.gov/drought/index_feb15.htm Last modified: 03/13/02 11:56:42 AM