
Provisional Assessment of Hydrologic Conditions in Virginia
March 08, 2002
Streamflows across the State are well below the normal range of flow expected during winter
months despite recent rain on March 2-3, 2002.
Streamflows are at levels expected during the
late fall months when flows
generally are at annual minimums.
New record minimum daily flows for March are expected at approximately half the streamgages
across the State except
for those streamgages in southwest Virginia. The minimum flows occurred
on March 1-2, 2002, before the statewide
rainfall elevated streamflows slightly. Statistically,
March has the highest minimum streamflow values for the year.
The drought of 1930-32 was the worst
drought in Virginia in at least 100 years.
Current streamflow,
while low, is not consistently at the low levels
experienced during the 1930ís drought. Below is
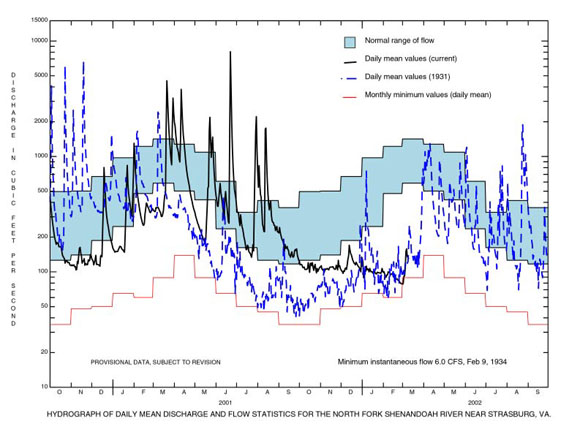
the hydrograph for the North Fork Shenandoah River at Strasburg, Va., which compares current
streamflow values with streamflow values during 1931. Ground-water
levels also are not at levels
experienced during the early 1930ís; however, ground-water data in Virginia are very limited.
Only
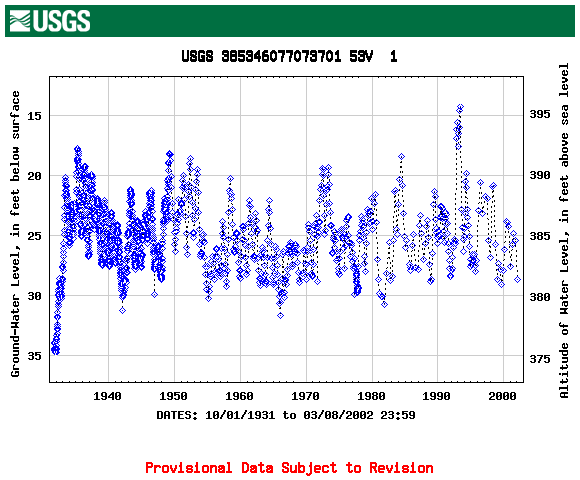
one well in Virginia has measurements that date back to 1931. Below is the hydrograph for a well
in Arlington County, Va. (53V 1). The data show that the
well was basically dry in 1931. Low
water levels
also are shown for the droughts in 1942, 1955, 1966, and 1982. Currently, the well water level is 5
or 6 feet above the minimum level
observed in 1931 and approximately 2 feet above minimum water
levels observed in
the 1942, 1955, 1966, and 1982 droughts. Also
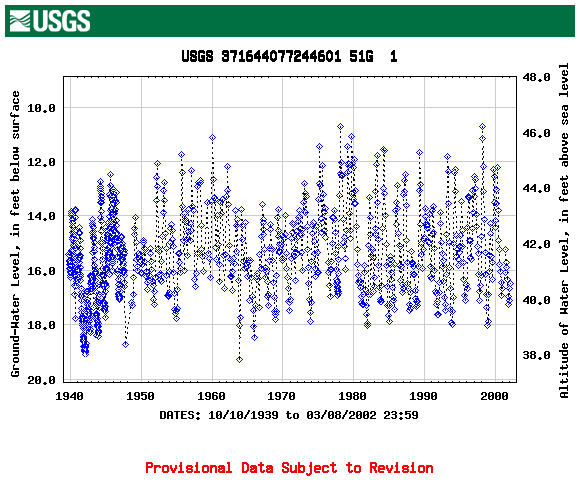
included is the hydrograph for a
well in Colonial Heights, Va. (51G1). The data show ground-water levels during the droughts in
1942,
1964-1966, and 1982. Currently, the well water level is approximately 1 foot above the minimum water
levels
observed during 1942 and 1964.
The following graphs and table give flow duration and current flow
conditions for selected U.S.
Geological Survey and Virginia Department of Environmental Quality ground-water
and surface-water
gaging stations. Data are
provisional and subject to revision. The
normal range of flows is defined as
flows in the middle two quartiles (between those flows equaled or exceeded 75
percent of the time and
those flows equaled or exceeded 25 percent of the time).
| HYDROGRAPH, NORTH FORK SHENANDOAH RIVER NEAR STRASBURG, VA |
 |
| ARLINGTON COUNTY WELL (53V 1) |
 |
| COLONIAL HEIGHTS CITY WELL (51G 1) |
 |
USGS--Water Resources of Virginia
Contact: GS-W-VArmd_webmaster@usgs.gov
U.S. Department of Interior,
U.S. Geological Survey
Privacy Statement
Disclaimer
URL://va.water.usgs.gov/drought/index_mar8.htm Last modified: 04/02/02 10:19:50 AM